Modelling Carbon Black Matthew Celnik, Tim Totton, Abhijeet Raj, - PowerPoint PPT Presentation
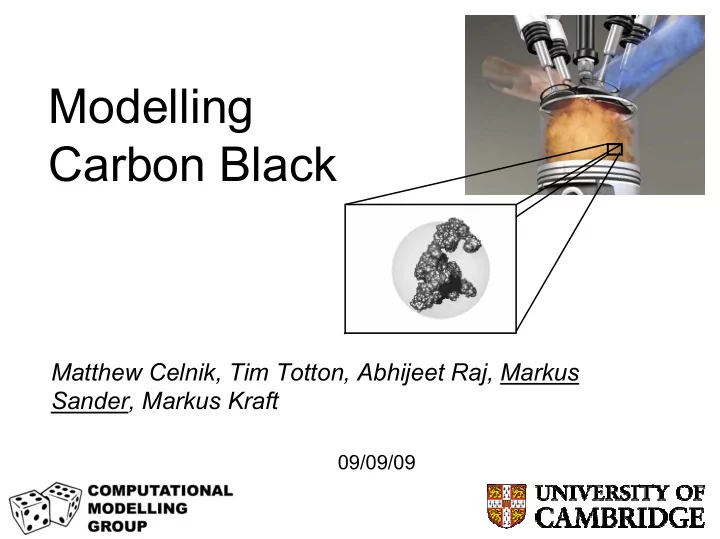
Modelling Carbon Black Matthew Celnik, Tim Totton, Abhijeet Raj, Markus Sander, Markus Kraft 09/09/09 Soot Formation Temperature Reaction Zone Burner Flame Carbon Addition Reactions Condensation of PAHs Particle Inception by PAHs
Modelling Carbon Black Matthew Celnik, Tim Totton, Abhijeet Raj, Markus Sander, Markus Kraft 09/09/09
Soot Formation Temperature Reaction Zone Burner Flame Carbon Addition Reactions Condensation of PAHs Particle Inception by PAHs Coalescense Aggregation Oxidation by O 2 and OH, Markus Sander ms785@cam.ac.uk
Molecular soot structure • Nanoparticles (3 nm – 2 µm) • ‘Primary particles’ occur due to dimerisation of PAH molecules • What is the critical PAH size to form a dimer in flame conditions? • What is the morphology of a soot particle? Markus Sander ms785@cam.ac.uk
Soot model hierarchy Full representation of molecules Quantum Chemistry (DFT) Determine kinetic parameters Functional site description PAH Aromatic Site Model (ARS) PAH reactions as jump processes Single planar PAH simulations Kinetic Monte-Carlo (PAH KMC) Used to generate internal particle structure Particle ensemble modelling Population Balance (PAH-PP) Particles described by PAH-PP Model Inception, growth and coagulation Markus Sander ms785@cam.ac.uk
Oxidation processes in PAHs PAH: Polyaromatic hydrocarbons Investigated reactions: Oxidation process: Decomposition process: Markus Sander ms785@cam.ac.uk
Using structural information Markus Sander ms785@cam.ac.uk
Oxidation rates of different site types Zigzag next to zigzag (zz) E act =156 kJ/mole Zigzag next to free edge (zf) E act =161 kJ/mole Armchair next to free edge (af) E act =173 kJ/mole Units: k in cm 3 /(mole*s), T in K Markus Sander ms785@cam.ac.uk
PAH reactions (selection) S1 Free-edge growth S2 Free-edge desorption S3 5-member ring addition S4 5-member ring desorption S5 Armchair growth S6 5- to 6-member ring Markus Sander Frenklach, Wang, Violi ms785@cam.ac.uk
PAH KMC growth simulation Seed molecule: Seed molecule: Pyrene Pyrene Growth of a PAH molecule – kinetic Monte Carlo (KMC) simulation Markus Sander ms785@cam.ac.uk
PAH growth mechanism Markus Sander ms785@cam.ac.uk
Particle Model Markus Sander ms785@cam.ac.uk
PAH-PP model: State Space P = C ( ,..., , ) P p p Structure of a particle: 1 n n : number of primary particles p of particle P C : Matrix containing the sphericity of the neighbouring primaries C ij =0 if p i and p j are not touching Each primary particle p i is composed of m PAHs: p = p ( PAH ,..., PAH ) i i 1 m Markus Sander ms785@cam.ac.uk
PAH-PP model: Data structure Contains: [C] 2,5 Contains: [C] 5,6 Markus Sander ms785@cam.ac.uk
PAH mass spectra J. Happold, H.-H. Grotheer, and M. Aigner. Rapid Commun. Mass Sp., 21:1247–1254, 2007. C 2 H 4 - O 2 flame, Pressure = 120 mbar, C/O = 1, Cold gas velocity = 54 cm/sec Monomers Monomers Dimers Dimers Experimental Computed Markus Sander ms785@cam.ac.uk
Coagulation efficiency 1 = C E ⎛ ⎞ ⎛ ⎞ 6 ⎛ ⎞ 3 ⎜ D M ⎟ ⎜ ⎟ + − + − min ⎜ min ⎟ 1 exp 2 5 ⎜ ⎟ ⎜ ⎟ ⎝ ⎠ M 1100 ⎝ ⎠ ⎝ ⎠ min = Coagulatio n efficiency C E = D Diameter of smaller PAH min = Mass of smaller PAH M min Markus Sander ms785@cam.ac.uk
PAH coagulation efficiency Markus Sander ms785@cam.ac.uk
Investigating structure • How do PAH molecules form clusters? • How do these clusters grow? • Driven by intermolecular potentials Alston Misquitta, Aron Cohen, Dwaipayan Chakrabarti, Mark Miller, David Wales Markus Sander ms785@cam.ac.uk
Basin hopping • Finds stable molecular clusters by searching for minima • Based on potential Energy energy ‘landscape’ • Uses Monte-Carlo criterion when ‘jumping’ between minima Markus Sander ms785@cam.ac.uk
Investigating structure • How do PAH molecules form clusters? • How do these clusters grow? • Driven by intermolecular potentials Alston Misquitta, Aron Cohen, Dwaipayan Chakrabarti, Mark Miller, David Wales Markus Sander ms785@cam.ac.uk
Experimental comparison Experimental HR-TEM images of an A TEM-style projection of a aggregate sampled from a diesel engine. computed cluster of 50 coronene Indicated are length scales of structures molecules within a primary particle (from Mosbach et al., 2009, Combustion and Flame). Markus Sander ms785@cam.ac.uk
Thank you! Please visit our website: http://como.cheng.cam.ac.uk Markus Sander ms785@cam.ac.uk
DISI Engine •Late injection produces stratified mixture. •Fuel rich regions close to spark gap. Image from www.engineforall.com Markus Sander ms785@cam.ac.uk
Soot in DISI Engine λ = 1.0 EOI = -50 CAD ATDC Markus Sander Spark = -30 CAD ATDC ms785@cam.ac.uk
Soot in DISI Engine 32.6 CAD ATDC 12.6 CAD ATDC 2.6 CAD ATDC Markus Sander ms785@cam.ac.uk
PAH growth rates - sensitivity P. Weilmünster, A. Keller, and K. H. Homann. Combust. Flame, 116:62–83, 1999. Markus Sander ms785@cam.ac.uk
Global minimum clusters 2 Coronene 5 Coronenes 10 Coronene molecules molecules molecules E = -94.90 kJ/mol E = -394.35 kJ/mol E = -926.42 kJ/mol Markus Sander ms785@cam.ac.uk
Comparison of potentials 20 • Poor agreement 10 between L-J 0 potential and Potential (kJ/mol) SAPT(DFT) -10 LJ Gr results -20 LJ SP LJ X W99 Gr • Good agreement -30 W99 SP W99 X with W99 SAPT Gr -40 SAPT SP SAPT X potential -50 2.5 3 3.5 4 4.5 5 5.5 6 Dimer Separation (Å) Graphite (Gr) Slipped Parellel (SP) Crossed (X) Markus Sander ms785@cam.ac.uk
Cluster Density • Need to define cluster volume • Used scaled ‘van der Waals’ radii • Define Volume in terms of scaling factor, α • Determine ‘critical’ α to determine density Markus Sander ms785@cam.ac.uk
Cluster density • Volume varies non-linearly with α • Choose critical α at minimum of d V /d α ( α crit = 1.7) • Corresponds to point where all intermolecular space is covered by overlapping spheres. Markus Sander ms785@cam.ac.uk
Varying density in our models • For α crit = 1.7, – coronene ρ = 1.1 g/cm 3 , pyrene ρ = 1.0 g/cm 3 • Standard soot density in models = 1.8 g/cm 3 • Density has been shown to be an important parameter Markus Sander ms785@cam.ac.uk
HRTEM images of soot • Some evidence for different soot structures based on different fuels • Top: ‘graphitic’ • Bottom: ‘amorphous’ Pictures from: Uitz, Cracknell, Jansma and Makkee, “Impact of diesel fuel composition on soot oxidation Characteristics”, SAE 2009-01-0286 Markus Sander ms785@cam.ac.uk
Recommend


More recommend
Explore More Topics
Stay informed with curated content and fresh updates.