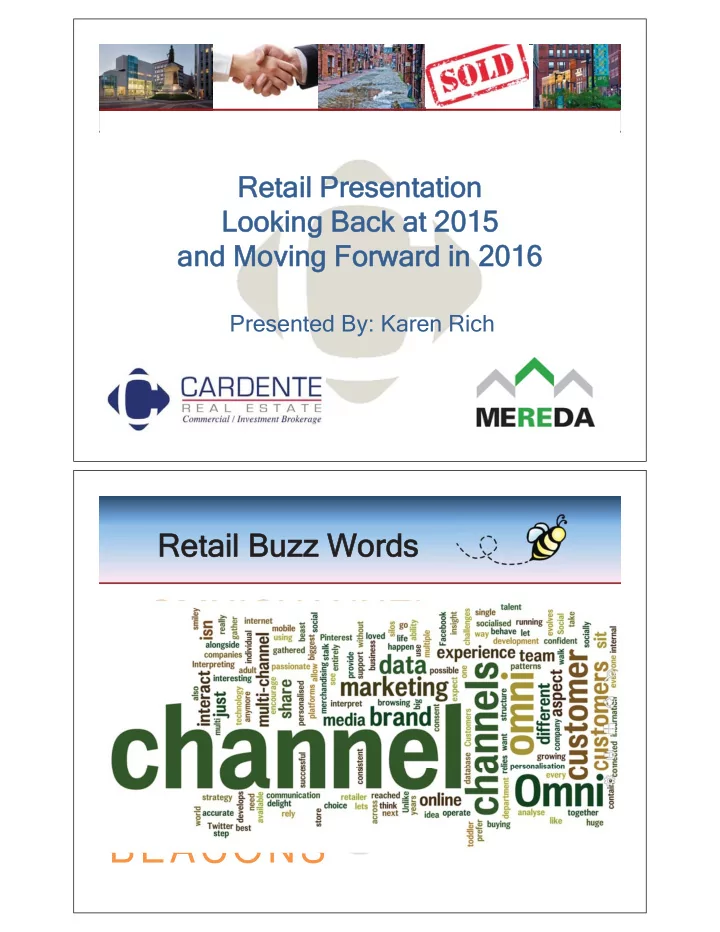
Retail Presentation Looking Back at 2015 and Moving Forward in 2016 Presented By: Karen Rich Retail Buzz Words OMNICHANNEL SOCIAL SOCIAL NETWORKS NETWORKS BRICKS & MORTAR MILLENNIALS POINTS-FOR-PURCHASE ECOMMERCE BEACONS
It’s All In The Numbers… 3.6% ZERO 6,460,7 38 39,625 1 2.6% Greater Portland Net Absorption Rate Comparison of 2015 vs. 2014 2015 � SF vs. 2014 � SF 6,460,738 Beginning � of � Year � Inventory 6,460,738 Beginning � of � Year � Vacant 237,658 277,283 Beginning � of � Year � Occupied 6,223,080 6,183,455 End � of � Year � Inventory 6,460,738 6,460,738 End of � Year � Vacant 232,589 237,658 End � of � Year � Occupied 6,228,149 6,223,080 Net � Absorption 5,069 39,625 Source: Malone Commercial Brokers
Greater Portland Vacancy Rate – By Type of Space Greater Portland numbers include Portland, South Portland, Scarborough, Falmouth, Westbrook and Cape Elizabeth Type of � Retail Total � Area Vacancy % 3,397,616 2.91 Power � Center 98,925 1,547,655 104,122 6.73 Community 426,401 18,362 4.31 Strip � Center 1,089,226 11,180 1.03 Single � Tenant � (over � 10,000 � SF) 6,460,898 232,589 3.60 Totals Source: Malone Commercial Brokers Greater Portland Vacancy Rate – By Town Greater Portland numbers include Portland, South Portland, Scarborough, Falmouth, Westbrook and Cape Elizabeth Town Total � Area Vacancy % 1,305,779 5.2% 68.071 Portland 3,004,466 72,666 2.4% South Portland 1,262,326 13,500 1.1% Scarborough 544,682 74,633 13.7% Falmouth 308,910 3,719 1.2% Westbrook 34,735 0 0.0% Cape Elizabeth Source: Malone Commercial Brokers
Vacancy Rate – Local vs. National 15.00% 13.1% 12.6% 12.6% 13.00% 11.9% 10.80% 10.5% 11.00% 9.7% 9.7% 10.9% 9.00% 8.34% 7.3% 6.93% 7.00% 6.0% 6.17% 5.8% 5.92% 5.61% 5.00% 4.29% 3.68% 3.60% 2.94% 2.62% 3.00% 1.00% -1.00% Greater Portland National Major Store Closures
Large Vacancies 2014-2015 Year End 2015 Year End 2014 Falmouth Shopping Center 66,630 62,970 Vacancies partly due to Shaw’s relocation in Center and Rite Aid moving to pad site Cabela’s 14,500 15,000 21,640SF (New construction 2008) Clark’s Pond 0 25,435 Pine Tree Shopping Center – some 34,662 30,262 vacancy due to Marden’s moving and not being completely re-leased Total 115,792 133,667 Average Lease Rates 2015 vs. 2014 Asking � Lease � Rate � Table � Comparison 2015 2015 2014 Range Average Average % Change $12-$30 $11.78 $11.78 -0.02% Prime Market $8-$31 $16.07 $16.07 0.02% Secondary Market $15.43-$19.80 $14.42 $14.42 -1.37% Overall Averages
New Construction & Major Relocations New Franchises to Maine
Relocations & Expansions Mainers Love Their Restaurants
Mainers Love Their Restaurants Old Port and Downtown Portland Positive news on the Old Port and Downtown Portland continues in 2015 • Anthropologie’s presence on Middle Street has increased demand • Restaurants, Restaurants, Restaurants • Average leases in the $25-$38 PSF range for spaces in the typical Old Port • size of 1200-1800 SF Almost zero vacancy rates on most of Commercial, Fore and Exchange Streets • East End and West End areas are booming as well •
Southern Maine Retail (Outside of Greater Portland Market) New and existing retailers expanding • Coastal Maine Popcorn, British Goods, Stirling & • Mull, Dube Music Purchase of 186 Lower Main St. by Midcoast • Federal Credit Union 2016 expansion planned for Freeport Village • Station Auto Zone on Route 302 • Deck House Restaurant at • Seacoast Franco’s Bistro • Low vacancy rates • Southern Maine Retail Continued • Route � 111 � Corridor � seeing � extensive � Main Street retail is more active in • interest � – local � and � national 2015 • New � projects � planned � for � 2016 Ground Round at Cinemagic • • Downtown � spaces � filling � with � new � 30,000-40,000 Retail/Office planned • restaurants � and � sports � bars at Mill building • Mill � buildings � – retail � will � follow � Increased activity • residential � growth
Significant Retail Sale Transactions in 2015 740 Broadway, South Portland – Strip Center $4,000,000 • Shops at Long Bank, Kennebunk – Hannaford anchored $6,900,000 • Sebago Plaza, Windham $1,050,000 • Cook’s Lobster House, Boothbay Harbor $1,250,000 • Topsham Crossing, Topsham $1,870,000 • Ryan’s Corner House, Wells $1,050,000 • Greater Portland 2016 Developments Marginal Way Projects Portland, ME Midtown Development Mixed Use 90,000± SF Retail Somerset Street, Portland, ME
New Developments Underway Coming Soon … Dirigo Plaza 550,000 ± SF Route 25 Portland/Westbrook, ME E-Commerce
Top Retail Trends in 2015 Boomers & Millenials Heavily Influence Retail • Social Networks Serve as Shopping Platforms • Corporate Social Responsibility • Retailers Experimenting with Technology • More Accessible & Powerful Data • Retailers Investing in Better Ways to Protect Customers • More Commerce Sites Offline • Retailers Localize • Mobile Growth – All Directions • Stores with Omnichannel Strategies will Continue to Thrive • Retail Trends for 2016
Predictions
Recommend
More recommend
Unleash a World of Digital Possibilities—Browse, Share, and Explore Content Without Boundaries