Methods and Results for Challenge 3A Robert Bruggner, Rachel Finck, - PowerPoint PPT Presentation
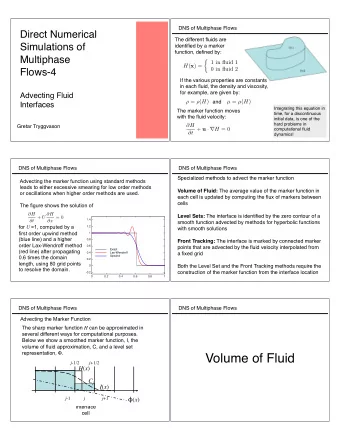
Methods and Results for Challenge 3A Robert Bruggner, Rachel Finck, Robin Jia, Noah Zimmerman Stanford University | rbruggner@stanford.edu FlowCAPII Summit Sept 23 2011 Challenge 3A and Method Overview Challenge 3A and Method Overview
Methods and Results for Challenge 3A Robert Bruggner, Rachel Finck, Robin Jia, Noah Zimmerman Stanford University | rbruggner@stanford.edu FlowCAPII Summit • Sept 23 2011
Challenge 3A and Method Overview
Challenge 3A and Method Overview • Given two tubes of data from a single patient, predict the antigen used in each tube
Challenge 3A and Method Overview • Given two tubes of data from a single patient, predict the antigen used in each tube • Our Approach: Automatically identify populations of cells by surface marker - Extract population meta-features and build model to predict antigen group -
Challenge 3A and Method Overview • Given two tubes of data from a single patient, predict the antigen used in each tube • Our Approach: Automatically identify populations of cells by surface marker - Extract population meta-features and build model to predict antigen group - • Identified a highly predictive population for determining antigen group
Surface Markers Normalized for Simple Cluster Matching
Surface Markers Normalized for Simple Cluster Matching • Surface marker expression variable between patients
Surface Markers Normalized for Simple Cluster Matching • Surface marker expression variable between patients • Need to establish population correspondence
Surface Markers Normalized for Simple Cluster Matching • Surface marker expression variable between patients • Need to establish population correspondence • Assume bimodal expression & landmark normalize
Cells Clustered With 2D Density-Based Merging & Greedy Dimensional Exploration
Cells Clustered With 2D Density-Based Merging & Greedy Dimensional Exploration • Data from all patients and conditions combined
Cells Clustered With 2D Density-Based Merging & Greedy Dimensional Exploration • Data from all patients and conditions combined • Combined data clustered in all pairwise sets of dimensions
Cells Clustered With 2D Density-Based Merging & Greedy Dimensional Exploration • Data from all patients and conditions combined • Combined data clustered in all pairwise sets of dimensions • Dimensions with highest confidence clusters selected
Cells Clustered With 2D Density-Based Merging & Greedy Dimensional Exploration • Data from all patients and conditions combined • Combined data clustered in all pairwise sets of dimensions • Dimensions with highest confidence clusters selected • Identified clusters recursively projected and clustered until no new clusters found
Per-patient Cluster Meta-features Extracted For Model Construction
Per-patient Cluster Meta-features Extracted For Model Construction • Data separated back into source components
Per-patient Cluster Meta-features Extracted For Model Construction • Data separated back into source components • Cluster Meta-features extracted Cluster density - Antigen condition density difference - vs negative controls Response of clusters in cytokine - response dimensions as quantified by Earth Mover's Distance (EMD)
Per-patient Cluster Meta-features Extracted For Model Construction • Data separated back into source components • Cluster Meta-features extracted Cluster density - Antigen condition density difference - vs negative controls Response of clusters in cytokine - response dimensions as quantified by Earth Mover's Distance (EMD) • Logistic Regression Classification Model built from features GLMNET
Cross validation Used to Identify Optimal Classifier and Features
Cross validation Used to Identify Optimal Classifier and Features • 100 runs of random 3-fold internal cross validation using different combinations of features
Cross validation Used to Identify Optimal Classifier and Features • 100 runs of random 3-fold internal cross validation using different combinations of features • Logistic regression model using cluster difference and EMD features had best performance
Cross validation Used to Identify Optimal Classifier and Features • 100 runs of random 3-fold internal cross validation using different combinations of features • Logistic regression model using cluster difference and EMD features had best performance • Used to predict test labels
Density of CD4/CD8 Double Positive T -cell Population Most Important Factor in Logistic Regression Model
Density of CD4/CD8 Double Positive T -cell Population Most Important Factor in Logistic Regression Model GAG# GAG# ENV# ENV# 0.42%# 0.42%# 0.21%# 0.21%# 0.18%# 0.18%# 0.27%# 0.27%#
Density of CD4/CD8 Double Positive T -cell Population Most Important Factor in Logistic Regression Model • Backgating suggest possibly two subpopulations within CD4/CD8 cells
Thoughts & Future Work
Thoughts & Future Work • Identification of CD4+/CD8+ population highlights unbiased nature of method
Thoughts & Future Work • Identification of CD4+/CD8+ population highlights unbiased nature of method • Need to identify all potentially predictive features and their predictive power for users
Thoughts & Future Work • Identification of CD4+/CD8+ population highlights unbiased nature of method • Need to identify all potentially predictive features and their predictive power for users • Automated methods critical for comprehensive exploration of higher-dimensional data
Thanks & Questions
Thanks & Questions • J. Irish, D. Parks, R. Tibshirani, D. Dill, & G. Nolan
Thanks & Questions • J. Irish, D. Parks, R. Tibshirani, D. Dill, & G. Nolan • FlowCAPII Committee
Thanks & Questions • J. Irish, D. Parks, R. Tibshirani, D. Dill, & G. Nolan • FlowCAPII Committee • NIAID
Thanks & Questions • J. Irish, D. Parks, R. Tibshirani, D. Dill, & G. Nolan • FlowCAPII Committee • NIAID • Questions? rbruggner@stanford.edu
Recommend


More recommend
Explore More Topics
Stay informed with curated content and fresh updates.