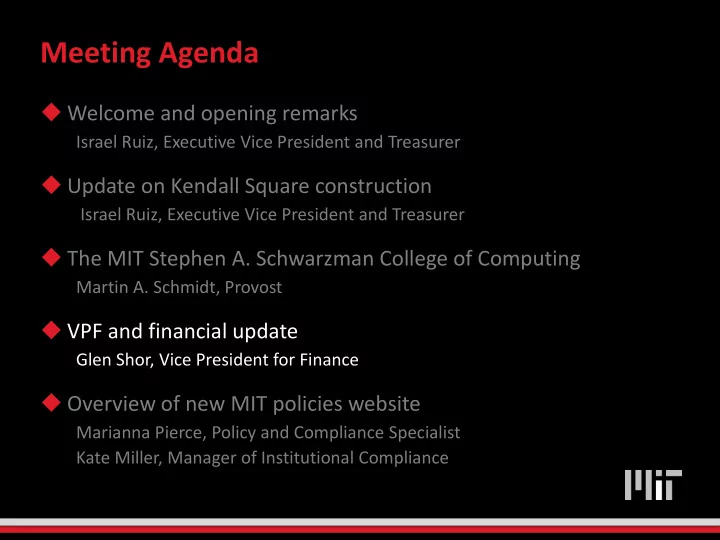

Meeting Agenda Welcome and opening remarks Israel Ruiz, Executive Vice President and Treasurer Update on Kendall Square construction Israel Ruiz, Executive Vice President and Treasurer The MIT Stephen A. Schwarzman College of Computing Martin A. Schmidt, Provost VPF and financial update Glen Shor, Vice President for Finance Overview of new MIT policies website Marianna Pierce, Policy and Compliance Specialist Kate Miller, Manager of Institutional Compliance
VPF and Financial Update Glen Shor, Vice President for Finance
VPF by the Numbers Fiscal Year 2018 5,110 60,086 1,478 $1.47 billion Contracts reviewed, Travel expense Tax negotiated, and signed Annual payroll reports forms $67.6 million 505,016 $2.18 billion In credit card payments via Payroll payments to Revenue via wires, checks, 450,000 transactions 21,782 individuals and internal transfers 5,702 2,980 3,928 $1.5 billion New pieces of Budget change equipment tagged Procurement transactions Payments processed on cards 381,000 invoices $3.6 billion $696 million 45,761 Campus sponsored Institute budgeted Journal vouchers research revenue collected expenditures 10% 4,307 60,000 299 Increase in leased Travel cards Departmental Pieces of equipment in space for The Engine budget submissions biennial inventory cycle
119
119 Wins in 2018 9 World Series Championships
VPF by the Numbers Fiscal Year 2018 5,110 60,086 1,478 $1.47 billion Contracts reviewed, Travel expense Tax negotiated, and signed Annual payroll reports forms $67.6 million 505,016 $2.18 billion In credit card payments via Payroll payments to Revenue via wires, checks, 450,000 transactions 21,782 individuals and internal transfers 5,702 2,980 3,928 $1.5 billion New pieces of Budget change equipment tagged Procurement transactions Payments processed on cards 381,000 invoices $3.6 billion $696 million 45,761 Campus sponsored Institute budgeted Journal vouchers research revenue collected expenditures 10% 4,307 60,000 299 Increase in leased Travel cards Departmental Pieces of equipment in space for The Engine budget submissions biennial inventory cycle
Net Assets Endowment $21.5B $10.3B $8.2B $16.4B $1.5B $6.5B $0.6B $0.4B $0.2B 1960 1970 1980 1990 2000 2010 2018
Campus Revenue Mix $328M $688M $1,118M $1,922M $2,603M Auxiliaries 5% 5% 5% 6% 6% 7% Fees, Services & 9% 11% 12% 15% Other Revenue 9% 10% Current Use Gifts & 12% 10% Pledge Payments 9% 9% 13% 22% 26% Support From 32% Investments 56% 46% 36% 32% 26% Research Revenue Non-Degree Tuition 1% 2% 2% Revenue 15% 13% 13% Net For-Degree 11% 11% Tuition Revenue 1981 1991 2001 2011 2018
Financial Aid Enhancements vs. Median Family Income 1961 - 2018 2001 - 2018 Nominal Real Nominal Real 84.5% Tuition 6.3% 2.5% 3.9% 1.9% 82.1% 78.3% Net Tuition 5.6% 1.8% 1.4% -0.5% Gross tuition 61.7% as % of median 51.8% family income 32.5% 34.2% 33.5% Net tuition as 31.1% 31.2% 29.5% % of median family income 18.9% Note: Net tuition and fees per undergraduate Median 1961 1981 1991 2001 2011 2018 student based on total financial aid / # Family undergraduates $5,700 $19,074 $30,126 $42,228 $50,054 $59,039 Income 2018 median family income calculations use Tuition $1,500 $6,200 $15,600 $26,050 $39,212 $49,892 2016 median family income $59,039 Source: MIT SFS; Median family income schedule F8 US Census
Capital Projects Summary 42C W41 17 W46 31 Site 5 9 12 66 Site 4 W97 54 Open space MB W16 W15 4 E40 2 14 W70 E52 W8 Under construction In design In planning Completed • • • • Vassar Street Residence (W46) Metropolitan Warehouse (W41) Green Building addition (54) Ralph Landau Building (66) • • • • MIT Chapel (W15) Central Utilities Plant (42C) Wright Brothers Wind Tunnel (17) Pierce Boathouse (W8) • • • Green Building renewal (54) Music Building (MB) Kresge Auditorium (W16) • • Kendall Square Hayden Library (14) Morris and Sophie Chang Building (E52) • • • MIT Museum (Site 5) Building 4 fourth floor The Simons Building (2) • • Innovation and Entrepreneurship Hub, Sam Tak Lee Building (9) • Building 31 Forum, Admissions, Graduate tower, • childcare (Site 4) Theater Arts Building (W97) • • Open spaces MIT.nano (12) • New House residence (W70) • Building E40 MicroMasters
Operating Results $280M $278M $246M $206M $183M $180M $180M $88M $77M $49M 2009 2010 2011 2012 2013 2014 2015 2016 2017 2018
Tools Training New Federal Tax Law Partnerships Savings
Making Progress, Step by Step Online Selection of Source Form
Making Progress, Step by Step Online Selection of Source Form Central Amazon Business Account Web-Based Selection of Source Form Updated Record Retention Policy
See Compare Built-in Choose forms No Smarter receipts systems needed
VPF Organization Chart VPF Headquarters Practice Practice Vice President and Process and Process for Finance Improvement Improvement Budget and Administrative Strategic Strategic Office of the Financial Treasury and Treasury and Financial Services and Controllership Sourcing and Sourcing and Recording Operations Planning Planning Analysis Operations Contracts Contracts Secretary Financial Accounts Systems Contracts Receivable and Data Cashier Strategic HR/Payroll Services Sourcing Financial Merchant Accounting and Services Reporting Accounts Accounts Property Office Payable Payable Procurement Procurement Sponsored Operations Operations Accounting Travel and Card Travel and Card Tax and Global Services Services Operations
Piecing It Together …
Piecing It Together …
Thank you
Recommend
More recommend