Malware analysis using visualized images and entropy graphs Kyoung - PowerPoint PPT Presentation
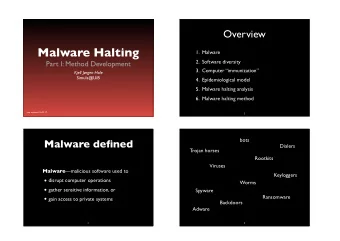
Malware analysis using visualized images and entropy graphs Kyoung Soo Han Jae Hyun Lim Boojoong Kang Eul Gyu Im Presented by Ruikai Zheng CISC850 Cyber Analytics 1.Introduction Malware variants developed using automated tools
Malware analysis using visualized images and entropy graphs Kyoung Soo Han · Jae Hyun Lim · Boojoong Kang · Eul Gyu Im Presented by Ruikai Zheng CISC850 Cyber Analytics
1.Introduction Malware variants developed using automated tools • Automated tools reuse modules • Similarities may exist among malware variants •
2.General Idea
3. Bitmap Image
Bitmap Image converter
Some examples
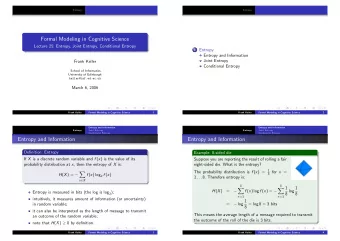
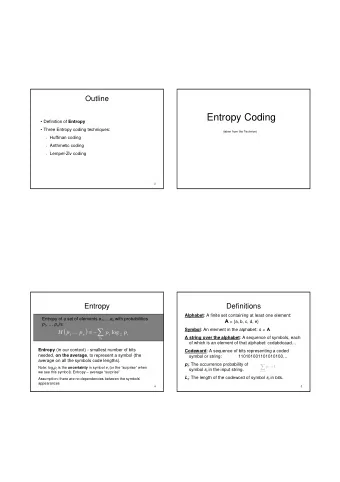
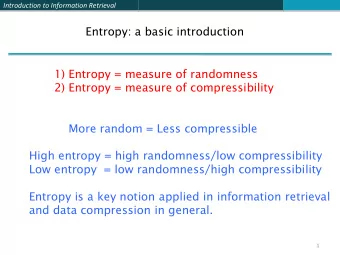
4. Entropy graph
Entropy graph generator For each line of bitmap image: (suppose the image is 256 * 256)
5. Compute similarities • Align the x-axes(the heights of bitmap images) of the two entropy graphs
Compute similarities • Compute K 1 and K 2 – K 1
Compute similarities • Compute K 1 and K 2 – K 2
Compute similarities • Similarity value
Experiment result
Experiment result
Experiment result • Threshold – False positive rate – False negative rate
Limitation • Malware applied with packing technique – The entropy values of binaries can be very high – Packed malware binaries are difficult to classify
Conclusion The paper proposed a malware visualization method that • using binary grayscale bitmap images and entropy graphs. The paper proposed a method to calculate similarities of • malware to classify malware families. Experimental results showed that proposed method can • classify malware families with a small false-positive/false - negative rate.
Thank you
Recommend


More recommend
Explore More Topics
Stay informed with curated content and fresh updates.