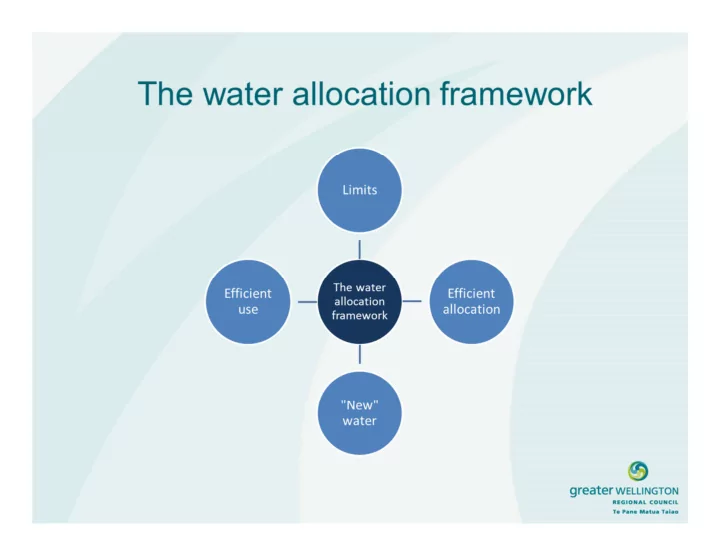

Limits (the size of the pie) allocation limits minimum reliability flow of supply Limits Implement climate minimum change flows multiple bands/ blocks
Multiple bands/block
How and where to set the limits?
Reliability of supply Allocation Limit Minimum Flows
Minimum flows Actual minimum flow
Allocation limit
Reliability of supply Water available Water not available for 20 days for 9 days
Minimum flow as % of 7dMALF 160% 140% 120% 100% 80% 60% 40% 20% 0%
Lower Ruamahanga River • Minimum flow 8.5 m3/s at Waihenga • Instream values and IFIM studies in 2007 • Adult brown trout identified as primary flow value • 90% habitat retention level selected. DO and water temp considered as well as boating and fish passage
Mangatarere River • Minimum flow 0.24 (upper) and 0.20 m3/s (lower) • IFIM & WAIORA late 1990s. CAP 2003 • Trout habitat & spawning an important feature • Dilution of CDC discharge also considered
Papawai Stream • Minimum flow 0.160 m3/s • Issues and flow assessment in 2008 • Objectives: longfin eels, DO levels, swimming
Lower Ruamahanga • Existing average reliability = 93% • Min Flow 50%, Reliability 10% Lower Ruamahanga River - Reliability of supply Lower Ruamahanga River - Reliability of supply 120% 120% 100% 100% 80% 80% Reliability Reliability 60% 60% during during summer summer 40% 40% % Existing Minimum Flow (8.5) 20% 20% % Existing Minimum Flow (8.5) % Min Flow 50% higher (12.5) 0% 0% 1990 1990 1995 1995 2000 2000 2005 2005 2010 2010 2015 2015
10 Feb 2015 ~12 cumecs 19 Feb 2015 ~4 cumecs 07 March 2015 08 March 2015 ~3.2 cumecs ~50 cumecs
How do outcomes change with different combinations of limits?
Testing limit scenarios Objective 1a. Loss of long fin eel habitat is <15% of that available at MALF Allocation Limit Habitat (% of MALF) Change (%) Minimum Flow (% of MALF)
Testing limit scenarios Objective 1b. Loss of torrent fish habitat is <15% of that available at MALF Allocation Limit Habitat (% of MALF) Change (%) Minimum Flow (% of MALF)
Testing limit scenarios Objective 2 . Reliability of full supply of >90% Allocation Limit Reliability (% of MALF) of Supply (%) Minimum Flow (% of MALF)
Testing limit scenarios Objective 3 . Reliability of partial supply of >95% Allocation Limit Reliability (% of MALF) of Supply (%) Minimum Flow (% of MALF)
Testing limit scenarios
Allocation efficiency (the framework – dividing up the pie) How is water allocated when it becomes available on common expiry dates for resource consents
Current water availability at full allocation No water available to new users when resource consents expire because: • existing users can retain their water • the sinking lid
Potential policy direction The maximum amount of water available for allocation (core allocation) shall not exceed whichever is the greater of: • The total amount allocated by resource consents • The limit identified in the Plan
When considering an application [for renewal of resource consent] … a consent authority must have regard to the value of the investment of the existing consent holder (RMA s104 (2A))
Key considerations How will the Committee address allocation on expiry of resource consents? • Potential allocation approaches: • status quo • market e.g. auction, tender • administrative e.g. priority allocation system, user groups, ballot, transfer • Equity vs existing investment?
Recommend
More recommend