Learning the Kernel and Finding Performance Problems with KFI Tim - PowerPoint PPT Presentation
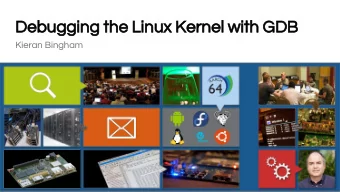
Learning the Kernel and Finding Performance Problems with KFI Tim Bird Sony Electronics, Inc. June 11, 2005 CELF International Technical Conferece, Yokohama, Japan 1 Introduction to KFI KFI = Kernel Function Instrumentation KFI uses
Learning the Kernel and Finding Performance Problems with KFI Tim Bird Sony Electronics, Inc. June 11, 2005 CELF International Technical Conferece, Yokohama, Japan 1
Introduction to KFI ● KFI = Kernel Function Instrumentation ● KFI uses gcc “–finstrument-functions” to insert callout code for every function entry and exit ● Provides for trace collection, including: ● timing, filtering, triggers for starting and stopping ● Provides tool for trace display and analysis June 11, 2005 CELF International Technical Conferece, Yokohama, Japan 2
KFI vs. Profiling ● OPROFILE takes samples of kernel (and application) execution location over time ● Doesn’t give complete trace coverage ● Good for statistical analysis of execution paths ● KFI gives exact trace of execution for a single instance ● Measures all executed routines ● Good for analyzing special cases (e.g. bootup) June 11, 2005 CELF International Technical Conferece, Yokohama, Japan 3
KFI vs. Event tracers ● Event tracer (e.g. LTT or LKST) ● Measures small number of discreet events ● Much lower overhead ● Good for long trace (even continous) ● Shows interactions between threads and processes – e.g. state transitions ● Carefully chosen event list ● KFI traces every kernel function ● High overhead, but very high detail June 11, 2005 CELF International Technical Conferece, Yokohama, Japan 4
Finding Performance Problems ● KFI measures function duration time by default!! ● Trace log has entry time and duration ● KFI keeps a stack of entered functions which is searches on function exit ● Normal overhead is low, because function being exited is first item on stack ● Duration is wall time from entry to exit ● Does NOT take into account (subtract) interrupts and thread switches ● Good for straightline code that does not block or get stuck on locks or semaphores June 11, 2005 CELF International Technical Conferece, Yokohama, Japan 5
KFI Modes ● Dynamic configuration ● Configure and start a trace from user-space ● Configuration written to /proc/kfi ● cat kficonf >/proc/kfi ● Static configuration ● Configuration is compiled into kernel, and started automatically on boot ● Configuration in kernel/kfistatic.conf ● Results are collected from /proc/kfi_trace in either case June 11, 2005 CELF International Technical Conferece, Yokohama, Japan 6
Configuration ● Triggers ● start, stop ● function entry, function exit, time ● Filters ● function duration (mintime, maxtime) ● interrupt context (noints, onlyints) ● specific functions only ● Size of trace buffer ● logentries June 11, 2005 CELF International Technical Conferece, Yokohama, Japan 7
Function Names vs. Addresses (in configuration file) ● Can use function name in kfistatic.conf ● Must use function address when writing config to /proc/kfi ● Provide sym2addr to convert ● sym2addr kficonf System.map >kficonf.addr ● cat kficonf.addr >/proc/kfi June 11, 2005 CELF International Technical Conferece, Yokohama, Japan 8
Function Names vs. Addresses (in trace output) ● Output from /proc/kfi_trace has addresses ● Can convert to function names with addr2sym: linux/scripts/addr2sym kfi.log -m System.map >kfi.lst ● June 11, 2005 CELF International Technical Conferece, Yokohama, Japan 9
Dynamic usage: Compile kernel with KFI enabled ● Boot kernel ● Configure KFI ● vi kficonf ● sym2addr kficonf System.map >kficonf.addrmap ● cat kficonf.addrmap >/proc/kfi ● Prime the trace ● echo “prime” >/proc/kfi ● Start trigger fires, Trace is collected ● Stop trigger fires, or user stops trace, or buffer is full ● e.g. echo “stop” >/proc/kfi ● June 11, 2005 CELF International Technical Conferece, Yokohama, Japan 10
Get trace from kernel ● Read trace from kernel, and write it to a file cat /proc/kfi_trace >/tmp/trace.log ● ● Resolve addresses on output linux/scripts/addr2sym <trace.log -m System.map >trace.lst ● June 11, 2005 CELF International Technical Conferece, Yokohama, Japan 11
Analyze trace ● Look at log directly for individual call events and function durations ● Use ‘kd’ for aggregate function counts and times ● Use ‘kd -c’ to show ascii call graphs June 11, 2005 CELF International Technical Conferece, Yokohama, Japan 12
Main Uses ● Learn kernel execution paths ● Measure timing of kernel routines ● Find problem areas – routines with long execution June 11, 2005 CELF International Technical Conferece, Yokohama, Japan 13
Learning Code Paths • Linux kernel source is very large, and code paths are often very difficult to follow in source Issue Problem Sometimes can’t tell if code is compiled Conditional code in or not. Jump tables and calls through Actual function executed determined function pointers at runtime. Preemption points and interrupts Cause unexpected execution flow • KFI can show “gory details” and the real story June 11, 2005 CELF International Technical Conferece, Yokohama, Japan 14
Example of hard-to-follow routine: serial8250_init (extract) serial8250_init Bouncing back and forth | uart_register_driver between serial_core code | serial8250_register_ports and driver code. Difficult to | | uart_add_one_port follow in source due to | | | uart_configure_port jumps through call tables. | | | serial8250_config_port | | | | serial8250_request_std_resource | | | tty_register_device | | | register_console | | | | serial8250_console_setup | | | | | uart_set_options | | | | | | serial8250_set_options | | | | | | | uart_get_baud_rate . . . June 11, 2005 CELF International Technical Conferece, Yokohama, Japan 15
Using KD to answer questions ● What functions are called? ● How long do the functions take? ● How many times are the functions called? ● What are the “problem” functions (where most time is spent)? June 11, 2005 CELF International Technical Conferece, Yokohama, Japan 16
Example 1 – Find delays in bootup ● Configuration ● Bootup log (unresolved) ● Bootup log (with symbols resolved) ● Summaries of the data using ‘kd’ June 11, 2005 CELF International Technical Conferece, Yokohama, Japan 17
Bootup Configuration begin Start trace on entry trigger start entry start_kernel to kernel, and stop just before entering trigger stop entry to_userspace user space (exec of /sbin/init) filter mintime 500 filter maxtime 0 Only keep functions lasting filter noints 500 microseconds or longer (Eliminate shorter ones) end June 11, 2005 CELF International Technical Conferece, Yokohama, Japan 18
Bootup Log (unresolved) Kernel Instrumentation Run ID 0 Logging started at 0 usec by entry to function 0xc000877c Logging stopped at 13199877 usec by exit from function 0xc00240dc All times are in microseconds. Filter Counters: Trace lasted 13 seconds Execution time filter count = 155574 Large number of short Total entries filtered = 155574 functions eliminated from Entries not found = 3929 trace (>90%) Number of entries after filters = 14628 Entry Delta PID Function Caller -------- -------- -------- ---------------- ------------ 0 -1 0 0xc000877c 0x10008094 0 958 0 0xc000ddd0 0xc000882c 0 948 0 0xc000fe14 0xc000de10 0 938 0 0xc000fd20 0xc000fe34 Function addresses are reported 10 919 0 0xc0044c9c 0xc000fdd4 June 11, 2005 CELF International Technical Conferece, Yokohama, Japan 19
Bootup Log (resolved) Kernel Instrumentation Run ID 0 Logging started at 13762527 usec by entry to function start_kernel Logging stopped at 23905279 usec by log full Function names and callpoints are resolved Filter Counters: Execution time filter count = 754501 Total entries filtered = 754501 Entries not found = 7216 Number of entries after filters = 20000 Entry Delta PID Function Caller -------- -------- -------- ---------------- ------------ 2 -1 0 start_kernel skpinv+0x190 392 25317 0 setup_arch start_kernel+0x3c 400 1390 0 do_init_bootmem setup_arch+0xec 437 1352 0 free_bootmem do_init_bootmem+0x110 -1 indicates function where 439 1348 0 free_bootmem_core free_bootmem+0x40 the exit was not seen during the trace June 11, 2005 CELF International Technical Conferece, Yokohama, Japan 20
Recommend
More recommend
Explore More Topics
Stay informed with curated content and fresh updates.
