Corporate Access Forum 2007 J&K Bank: From Consolidation to Growth MAY 21 – 25 Singapore
Structure of Presentation Structure of Presentation • Profile of the Bank Profile of the Bank • • Plan & Strategy of Change Plan & Strategy of Change • • Performance and Outcome Performance and Outcome • • Potential of Growth Potential of Growth • • Perspective and Macro Perspective and Macro- -economic Context economic Context • May 21-22, 2007 2
Basic facts Basic facts � Incorporated in 1938 as a limited liability company � Listed on National stock exchange (NSE) and Bombay stock exchange (BSE) � 53 per cent owned by J&K Government � Rated “ P1 + ” by Standard and Poor- CRISIL: highest degree of safety � Four decades of uninterrupted profitability and dividends May 21-22, 2007 3
One of a Kind Kind One of a • Private sector bank despite government ’ s majority holding • Sole banker and lender of last resort to the Government of J & K • Only private sector bank designated as RBI ’ s agent for banking business • Carries out banking business of the central government • Collects taxes for Central Board of Direct Taxes in J & K May 21-22, 2007 4
Shareholding Pattern 10.41 0.29 0.67 53.17 34.34 1.12 GOVERNMENT OF J&K INDIAN MUTUAL FUNDS FOREIGN INST. INVESTORS RESIDENT INDIVIDUALS NON RESIDENT INDIANS Bodies Corporat/Banks/Insu As on March 2, 2007 May 21-22, 2007 5
Infrastructure Infrastructure • Fastest growing bank with 525 branches • 98 per cent business computerized • Anywhere, Tele-banking and S WIFT • Internet, S MS and Mobile Banking • Globally connected ATM network • Mobile ATM S ervice • Global Access Debit & Credit Cards • Live on RTGS S ystem of RBI May 21-22, 2007 6
Other Services: Other Services: • Insurance joint venture with MetLife International • Distributor of: • Life Insurance products of MetLife • Distributorship of Bajaj Allianze General Insurance • Providing Depository Services • Offering Stock Broking Services • Collection Agent for utility services May 21-22, 2007 7
Plan May 21-22, 2007 8
New business strategy New business strategy • Two legged business model: – Increase lending in J&K, which is • high margin, low volume – target niche lending in rest of the country, to • Improve margins and build volumes – Universal Bank in J&K – Specialist bank in rest of the country May 21-22, 2007 9
New Strategy : Analytics New Strategy : Analytics • O perating in a “ closed” economy: • limited Leakages • lending akin to reserve money • More lending within the state: • more incomes are generated • low cost saving deposits • Virtuous cycle of lending and saving • liquidity remains within the bank’ s system, giving: • Rising yields • Better margins • Higher profitability May 21-22, 2007 10
Operational aspects Operational aspects • A change in composition of advances – In terms of geography – from ROI to J&K – In terms of asset types – from low margin to high margin • A greater focus on liability management – Increase low cost retail deposits – Increase the maturity structure • A more focused balance sheet May 21-22, 2007 11
Carving a niche, nationally Carving a niche, nationally • Nationally, lending in consortium to large corporates – Reduces margins • To improve margins focus on: • Under-serviced areas with high turnover • Specialised sectoral lending • Specialist branch chain – leather, grains, spices • Re-pricing • A universal bank in J&K and a specialist bank outside May 21-22, 2007 12
New business initiatives • Innovative financial products • Monetizing the Bank’s branch network • Third party product distribution • Investment banking • Venture capital financing • Channel financing May 21-22, 2007 13
New financial products •Mismatch between growth sources and credit supply •High growth and yield areas under- serviced in terms of credit •Major sectors like horticulture still financed informally •Artisan economy not financed May 21-22, 2007 14
Third party products Third party products • Make branch network a distribution channel for financial products • Reduce incentive for major banks to enter J&K • Beef up non-interest incomes • Reduce income volatility • Make assets sweat harder • Improve business per branch per person May 21-22, 2007 15
Investment banking Investment banking • Leveraging our core competence of domain and geographical expertise, and having • J&K Government a captive client – State Government investing $240 billion in power over four years – Mandated to take Power Development Corporation public May 21-22, 2007 16
Organizational restructuring • Aligned people strategy to business strategy • New business processes aligned to changing banking environment • Performance based variable pay introduced • Business centric organisational structure created • Brand Strategist and visual makeover done • Re-designing its visual brand image and give it a very distinctive and contemporary bank personality May 21-22, 2007 17
Performance Performance May 21-22, 2007 18
Better liability structure Better liability structure 38 37 36 35 34 33 32 31 30 29 28 2004-2005 2005-2006 2006-2007 May 21-22, 2007 19
Cost of Deposits Cost of Deposits 4.7 4.65 4.6 4.55 4.5 4.45 4.4 2004-2005 2005-2006 2006-2007 May 21-22, 2007 20
Higher Asset pricing Higher Asset pricing 9.5 9.3 9.1 8.9 8.7 8.5 8.3 8.1 7.9 7.7 7.5 2004-2005 2005-2006 2006-2007 May 21-22, 2007 21
Cost to income ratio Cost to income ratio 48 46 44 42 40 38 36 2004-2005 2005-2006 2006-2007 May 21-22, 2007 22
Rising margin Rising margin 3.2 3 2.8 2.6 2.4 2.2 2 2004-2005 2005-2006 2006-2007 May 21-22, 2007 23
Return on assets Return on assets 1.2 1 0.8 0.6 0.4 0.2 0 2004-2005 2005-2006 2006-2007 May 21-22, 2007 24
Return on equity Return on equity 16 14 12 10 8 6 4 2004-2005 2005-2006 2006-2007 May 21-22, 2007 25
Earning per share Earning per share 60 55 50 45 40 35 30 25 20 15 10 2004-2005 2005-2006 2006-2007 May 21-22, 2007 26
NPA coverage NPA coverage NPA COVERAGE RATIO (%) 75 70 65 60 55 50 45 40 Q4 0405 Q1 0506 Q2 0506 Q3 0506 Q4 0506 Q1 0607 Q2 0607 Q3 0607 May 21-22, 2007 27
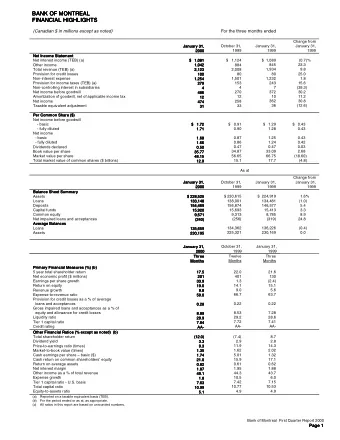
Financial : Valuations ratios Financial : Valuations ratios S.No. Ratios 2005-2006 2006-2007 1 Earning per Share (annualized) 36.48 56.62 2 Net Asset Value 371 .2 41 4.36 3 Adjusted Book Value 343.43 374.43 4 Price to book value ratio 1 .23 * 1 .73 @ 5 Price to adjusted book value ratio 1 .33 * 1 .91 @ 6 Price Earning Ratio (On Annualised EPS) 1 2.50 * 1 2.63 @ 7 Market Cap. To Deposits (%) 9.41 % * 1 3.77% @ 8 Market price as on date ( Rs. ) 456.05 * 71 4.85 @ 9 No. of Shares 48477702 48477702 May 21-22, 2007 28
Profitability Ratios Profitability Ratios 1 0 Net Interest Margins (%) 2.68% 2.97% 1 1 Interest Spreads (%) 2.61 % 2.79% 1 2 Yield on Advances (Av) (%)(annualized) 8.48% 8.58% 1 3 Yield on Investments (Av) (%)(Annualized) 6.22% 6.20% Monthly average 6.74% 6.65% 1 4 Cost of Deposits (Av) (%) (annualized) 4.55% 4.50% Monthly average 5.25% 5.28% 1 5 Return on Assets (%) (annualized) 0.67% 0.96% (Monthly average) 0.79% 1 .1 4% 1 6 Return on equity (%) (annualized) 1 0.21 % 1 4.67% 1 7 Gross Profit to AWF (%) (annualized) 1 .69% 2.02% 1 8 Net Profit to AWF (%) (annualized) 0.70% 1 .00% May 21-22, 2007 29
Asset Quality: Asset Quality: 27 Gross NPAs ( Rs. in Mns) 3702 5018 28 Net NPAs ( Rs. in Mns) 1339 1936 29 Gross NPA Ratio ( %) 2.52% 2.89% 30 Net NPA Ratio (%) 0.92% 1.13% 31 NPA Coverage Ratio (%) 63.64% 61.43% 32 Gross NPA to Net Worth Ratio (%) 20.57% 24.98% 33 Net NPA to Net Worth Ratio (%) 7.44% 9.64% May 21-22, 2007 30
Operating ratios: Operating ratios: 2005-2006 2006-2007 34 Operating Expenses to AWF (%) (annualized) 1 .36% # 1 .35% # 35 Operating Expenses to Total Income (%) 1 9.00% # 1 8.08% # 36 Operating expenses to other income (%) 31 1 % # 232.48% # 37 Staff Cost to Total Income (%) 1 0.59% # 1 0.69% # 38 Interest Earned to AWF (%) 6.71 % # 6.89% # 39 Non Interest Income to AWF (%) 0.44% # 0.58% # 40 Capital Adequacy Ratio (%) 1 2.1 4% 1 3.24% Tier I 1 1 .76% # 1 2.60% # Tier II 0.38% # 0.64% # May 21-22, 2007 31
Efficiency Ratios: Efficiency Ratios: 2005-2006 2006-2007 20 Cost to Income Ratio (%) 44.57% 40.1 3% 21 CD Ratio (%) 61 .67% 67.79% 22 CASA Ratio (%) 34.1 7% 37.02% 23 Business per Employee (Rs. In Mns) 55.57 61 .74 24 Net Profit per Employee (Rs. In Mns) 0.26 0.4 25 Business Per Branch (Rs. In Mns) 845.61 937.34 26 Net Profit per Branch ( Rs. in Mns) (Annualized) 3.94 6.09 May 21-22, 2007 32
Perspective May 21-22, 2007 33
Triad of potential Triad of potential A. Restoration of Peace B. Low base A. Normal Growth effect B. Gap Filling C. Reconstruction May 21-22, 2007 34
Recommend
More recommend
Unleash a World of Digital Possibilities—Browse, Share, and Explore Content Without Boundaries