IXP as an Internet Vantage Point Nikolaos Chatzis, Georgios - PowerPoint PPT Presentation
On the Benefits of Using a Large IXP as an Internet Vantage Point Nikolaos Chatzis, Georgios Smaragdakis * , Jan Boettger, Thomas Krenc, Anja Feldmann TU Berlin/*T-Labs Walter Willinger Niksun Internet Vantage Points CDNs, Hosters Tier-1
On the Benefits of Using a Large IXP as an Internet Vantage Point Nikolaos Chatzis, Georgios Smaragdakis * , Jan Boettger, Thomas Krenc, Anja Feldmann TU Berlin/*T-Labs Walter Willinger Niksun
Internet Vantage Points CDNs, Hosters Tier-1 Networks Distributed Server Peer in multiple locations Infrastructures Regional/Tier-2 ISP1 ISP2 Providers Customer Networks Source: Arbor, “Internet Inter-Domain Traffic”, SIGCOMM’10
A Unique Vantage Point: IXP CDNs, Hosters Tier-1 Networks Distributed Server Peer in multiple locations Infrastructures + Single Location IXP + Diverse set of Connecting Networks Regional/Tier-2 ISP1 ISP2 Providers Customer Networks Source: Arbor, “Internet Inter-Domain Traffic”, SIGCOMM’10
Internet eXchange Point (IXP) AS2 AS3 AS1 Layer-2 switch AS4 AS6 AS5
..in reality IXP is more than a Switch Complex system A number of services are offered For a survey: “There is More to IXPs than Meets they Eye”, ACM SIGCOMM CCR, Oct. 2013 Source: DE-CIX, 2012
Largest IXPs Name Main City Members Max Thr. Av. Thr. Traffic/day (ca. 2013) DE-CIX Frankfurt ~500 2.5Tbps 1.4Tbps ~15 Petabytes/day AMS-IX Amsterdam ~620 2.5Tbps 1.3Tbps ~14 Petabytes/day LINX London ~440 1.5Tbps 1Tbps ~11 Petabytes/day Equinix All cities ~750 1.4Tbps 1Tbps ~11 Petabytes/day DataIX Moscow ~130 1.1Tbps 0.7Tbps ~7.5 Petabytes/day MSK-IX Moscow ~600 1Tbps 0.4Tbps ~4 Petabytes/day NetNod Stockholm ~65 .5Tbps 0.3Tbps ~3 Petabytes/day … Traffic comparable with this of Large Tier-1 Networks: AT&T: ~33 Petabytes/day (ca. July 2013) Deutsche Telekom: ~16 Petabytes/day (ca. July 2013) Source: Public information from corporate websites, 2013
Largest IXPs Name Main City Members Max Thr. Av. Thr. Traffic/day (ca. 2013) DE-CIX Frankfurt ~500 2.5Tbps 1.4Tbps ~15 Petabytes/day AMS-IX Amsterdam ~620 2.5Tbps 1.3Tbps ~14 Petabytes/day LINX London ~440 1.5Tbps 1Tbps ~11 Petabytes/day Equinix All cities ~750 1.4Tbps 1Tbps ~11 Petabytes/day DataIX Moscow ~130 1.1Tbps 0.7Tbps ~7.5 Petabytes/day MSK-IX Moscow ~600 1Tbps 0.4Tbps ~4 Petabytes/day NetNod Stockholm ~65 .5Tbps 0.3Tbps ~3 Petabytes/day Growth rates at the largest IXPs in Europe: … + 10-20% new members/year + 50-100% more traffic/year + Offer 100Gbps ports Traffic comparable with this of Large Tier-1 Networks: AT&T: ~33 Petabytes/day (ca. July 2013) Deutsche Telekom: ~16 Petabytes/day (ca. July 2013) Source: Public information from corporate websites, 2013
Our Vantage Point: A Large IXP Access to a Large European IXP (city metro) Acknowledgments for the great collaboration with the IXP What we know about this IXP from [1] in 2012 (traces from 2011) Detailed study of the “inside” picture of the IXP Main focus on connectivity Rich Ecosystem of IXP Members: Access Networks CDNs/Hosters Transit Providers Service Providers/Streamers Very dense peering among members, 50K+ out of the 78K possible, i.e., peering rate of 60%+ [1] “Anatomy of a Large European IXP”, SIGCOMM’12
Open Questions What about the IXP as a vantage point for the Internet? Local vs. Global traffic visibility Stability vs. Trends in traffic flows What about the IXP as a vantage point for the commercial part of the Internet traffic? Who is responsible for how traffic flows through the Internet: AS or Organizations or both? What is the implication for traffic on peering links?
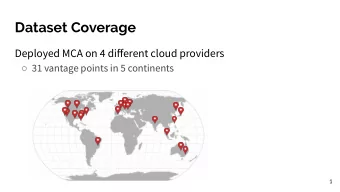
IXP Measurements sFlow Data Collection: 17 consecutive weeks of sFlow data, weeks 35-51 2012 (August-December 2012) Sampling Rate: 1/16K packets Sampling Size: First 128 bytes of Ethernet frame 74 bytes of TCP payload 86 bytes of UDP payload Traffic Volume Statistics: Beginning: 443 members, ~12 Petabytes/day End: 457 members, ~14 Petabytes/day
IXP Network Visibility 1 week in Nov ( ) In a single week, we monitor traffic from essentially: all active ASes (recall there there are ~480 member ASNs, or 1% of all active ASes) all actively routed prefixes all countries
IXP Server Visibility Servers are the engines of e-commerce and applications Server Identification: Via HTTP: String matching applied to the first line in response/request packets (e.g., GET, HEAD, POST, HTTP/1.{0,1}). Commonly used HTTP header fields according to RFCs and W3C specifications. Via HTTPS: Step 1: Consider IPs that use TCP port 443. Step 2: Crawl each of these IPs for X.509 certificate chain. Step 3: Check if the X.509 is valid. Limitations: String matching may miss servers if there is no sufficient information in the payload. Some servers may mis-classified as clients when they behave as clients when communicating with other servers. HTTPS servers that do not use 443 will be missed.
IXP Server Visibility 1 week in Nov ( ) Traffic from: 17% of the actively routed prefixes, 50% of the active ASes, 200 of the countries Observations: Most popular ports: 80/8080 (80%), 1953 (~5%), 453 (~5%) ~250K HTTPS server IPs Many servers use multiple ports
IXP-external Traffic? CDN B CDN A Data Center X IXP ISP1 ISP3 ISP2
IXP Internet Visibility Great visibility of non-IXP members: peer of IXP members, and peer of peers of IXP members! Beyond local traffic: 28% of total traffic and 17% of server traffic does not originate from an IXP member!
IXP: Local yet Global Visibility
IXP: Local yet Global Visibility
IXP: Local yet Global Visibility
IXP: Local yet Global Traffic
IXP Server Blind Spots Which servers we can not see in the IXP and Why? Source I: Large European Tier-1 ISP Full packet traces, thus very high accuracy in identifying servers and new URIs. Source I1: Top-1M Alexa Additional URIs from these retrieved from the IXP . Source III: Open DNS Resolvers 25K open resolvers in 12K ASes. We resolved all the URIs.
IXP Server Blind Spots By combining all the IXP-external measurements we identified 600K server IPs, from which only 240K are new. The identity of the 240K “hidden” server IPs: Private clusters of CDNs and Datacenters that are serving only customers of the same AS. CDN servers in distant regions; This is to be expected as CDNs can well localize the content. Traffic exchanged via private peering. Hybrid Server Architectures if they are not using HTTP/ HTTPS.
Server Activity: Stable yet Changing RU US DE ~70% of the total IXP traffic is due to server activity ~55% of the total IXP traffic is due to “stable” server IPs.
Server Activity: Global Observer Hurricane Sandy RU US DE Steady increase of HTTPS traffic from 5% to 6% of total traffic
Server Activity: Local Observer Deployment of New Servers and Business Trends: Amazon EC2 in Europe: Increase of number of IPs last weeks of the year/before Christmas (e-commerce hot period). First Installations of Netflix in Europe. New installation of Google caches within European ISPs. A number of outages of cloud providers with infrastructures located in Europe. IXP Resellers: Significant increase of traffic, the number of servers using resellers to send traffic doubled. …
Open Questions What about the IXP as a vantage point for the Internet? Local vs. Global traffic visibility Stability vs. Trends in traffic flows What about the IXP as a vantage point for the commercial part of the Internet traffic? Who is responsible for how traffic flows through the Internet: AS or Organizations or both? What is the implication for traffic on peering links?
Moving Beyond the AS-level View Given that a Large IXP is a unique vantage point, how we can use it to understand traffic flow in the Internet? What is the right abstraction? ASes Organizations, e.g., Google, Akamai, etc Google AS1 AS1 Akamai Akamai
An Alternative Grouping of Server IPs We rely on recent results on how to map server IPs to commercial entities (organizations). See, e.g., DNS to Rescue: Discerning Content and Services in a Tangled Web, IMC’12. Web Content Cartography, IMC’11. Flexible Traffic and Host Profiling via DNS Randevouz, SATIN’11. For each server IP , we collect the following information from passive and active measurements: Passive: URI Active: related DNS queries/answers, reverse DNS (hostname), X.509 certificate (when available),
AS Heterogeneity: #Server IPs per Organization . Akamai . Organization Google SoftLayer Hosteurope 143 clusters with more than 1000 servers 6K clusters with more than 10 servers
AS Heterogeneity: #Organizations per AS . . AS Hetzner Deutsche Telekom Softlayer VKontakte Akamai A single AS may host 10K+ server IPs and 100s of organizations
AS-link Heterogeneity AS2 Akamai AS Akamai Link Akamai (AS1) IXP Akamai AS3 AS4 Akamai
AS-link Heterogeneity Akamai . Member Akamai member AS peers with more than 400 networks.
Recommend


More recommend
Explore More Topics
Stay informed with curated content and fresh updates.