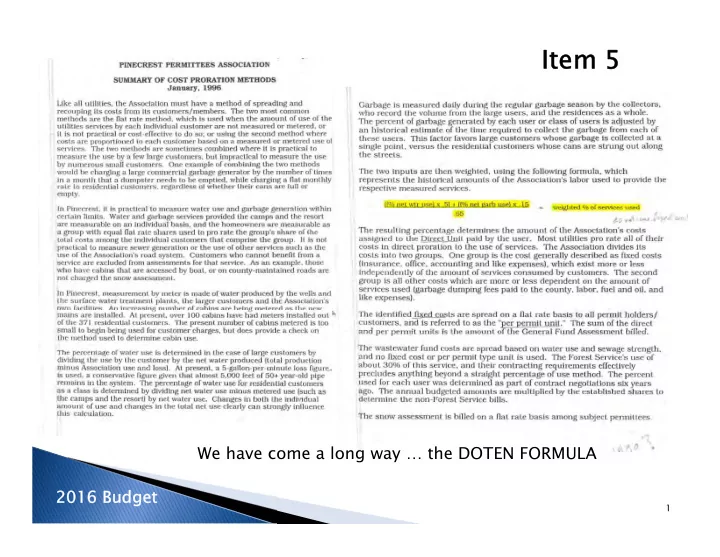

Item 5 Item 5 We have come a long way … the DOTEN FORMULA 2016 2016 Budget Budget 1
FIVE FUNDS FIVE FUNDS Trash 400 Trash 400 General 100 General 100 Admin 500 Admin 500 Water • Accounting Roads • • Legal Fire/Emergency • • Liability/Fire Insurance Sewer 200 Sewer 200 • Miscellaneous [ non-attributable ] Snow 300 Snow 300 • Our actual expenditures have declined over the last five years. We do not have a full year’s data for 2015 so we extrapolate. It is worth noting that this does include the busiest & most expensive months of the year. Expe Expenses History History 2
Notes: 1>Chinquapin meter was found unreliable .. It was replaced 2> We no longer need to estimate our leakages .. These are actual based on production less delivered and billed. Water Production Water Production History History 3
‘Water Use’ still plays a role in fee attribution. It relates directly to Se Sewe wer Fund r Fund costs and is a major part of the Gene General ral Fund Fund expenses. Administr Admini stration Fund Fund expenses are allocated to each of the other funds as a ratio9 of the total budget. The Trash Fund Trash Fund & Snow Fund Snow Fund are paid by the cabin users with a set fee. PPA Water PPA Water Use Use 4
Water & Sewer Water & Sewer Prorations Prorations 5
Our budgeted Income was slightly greater than our budgeted expenses. 2015 2015 Fees Fees Paid Paid 6
We are within our BUDGET PARAMETERS …. This [2015] year we expect to expend the approximate amount we have in our budgeted funds … and our INCOME was extrapolated to $953,920. Recall that we rebuilt the Camp Blue Sewer Pumps … a $91,262 hit and we also purchased a Truck Chassis for $49,500 which is included [$12,375 ea fund] in the ‘CURRENT’ column. Our Sewer Budget last year was $454,300. Budge Budget t History History 7
2016 BUDGET PROPOSAL [NOTE that THE 2016 PROPOSED BUDGET is only 8% over 2015 years PROJECTED EXPENSES of $908,442] Any proposal to pay for this must take into account our current financial status and the accrual trends. Budge Budget History & t History & 2016 Proposal 2016 Proposal 8
Current & Recent Fund B rrent & Recent Fund Balances lances [includes CD Funds] [includes CD Funds] We are showing growing FUND BALANCES ∴ it seems we could hold our CURRENT FEES … this is open to Board discussion. Now we can examine out 2016 FEE STRUCTURE with slight variances from this year. Fund B Fund Balances lances 9
We have several options on ‘cost-of-living adjustments’ for staff. These will impact the FEE OPTIONS following. Staff COLA Staff COLA Consideratio Considerations ns 10
Holding Curren Holding Current t Fees Fees 11
Decreasing Fees Decreasing Fees Slightly Slightly 12
Increasing Fees Increasing Fees Slightly Slightly 13
NOTE: 97.6% of our cabin users are below the 50,000 gallons ‘BASE TIER’ we adopted last year. Cabin Use Cabin Use Tiers Tiers 14
Commercial & Camp Water Use Tiers [History] Last year we used the AVERAGE Gallons from a (2 or) three year track record [The Chinquapin meter was problematic]. We may want to consider some more memorable (rounder?) tier levels for our C/C members. I have made a suggestion based on trends and current (2014-15) use. 2014 2014 Water Water Tiers Tiers Adopted Adopted 15
Impacts of ‘surcharge’ at $10/10kGal Rate (Adopted in 2014 Budget) NOTE NOTE COST COST GALLONS LLONS 1 53,760 Prior > 2010-11 $37.60 2 51,500 No Recent Prior $15.00 3 89,430 Prior> 2013-14 $394.30 4 92,380 Prior> 2011-12 & 2013-14 $420.38 5 56,820 No Recent Prior $68.20 6 57,150 No Recent Prior $71.50 7 633,190 Prior> 2011-12 [PPA Connection] NC 8 110,650 Prior> 2011-12 & 2013-14 [yr round] $606.50 9 55,900 Prior > 2011-12 $59.00 10 695,340 No Recent Prior $6,453.40 1,896,120 1,896,120 $8,125.88 $8,125.88 This is the cost of excess water to those who used excess. Potential Surcharge Potential Surch rge Impacts Impacts 16
This is a sample of what the Bill would look like . The notation in the box and the dates will change. We will provide the meter readings for each year. Sample Billing Sample Billing 17
2015 General Fund & Gen Fund Administrative Costs [extrapolated from ¾ year activities [see slide #7 ] $270,919 + $35,570 = $306,489 Gallons produced for ‘Delivery’ [see slide #3] 16,087,209 Gallons Yields a cost of ~$19.05/kGallons Adding a 10% mark-up results in a cost of: $20.96/kGallons Suggest: $21.00/kGallons Retail Fees Retail Fees 18
19
20
21
22
23
24
25
26
27
28
29
30
31
32
33
34
Recommend
More recommend