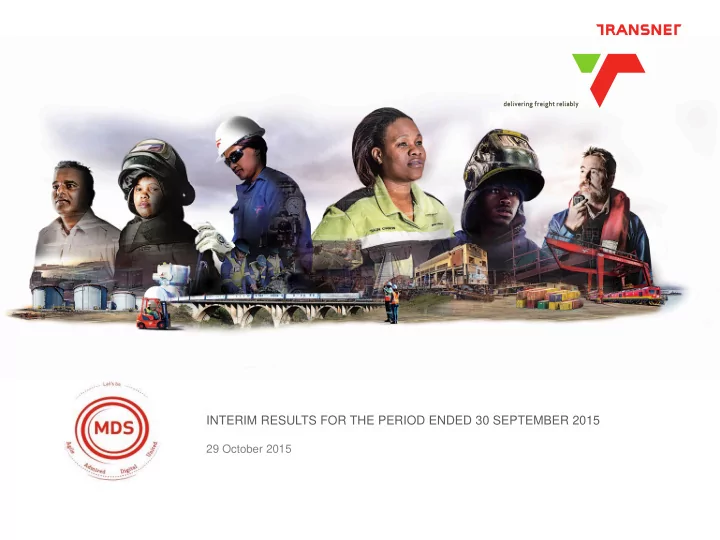
INTERIM RESULTS FOR THE PERIOD ENDED 30 SEPTEMBER 2015 29 October - PowerPoint PPT Presentation
INTERIM RESULTS FOR THE PERIOD ENDED 30 SEPTEMBER 2015 29 October 2015 AGENDA FOR THE PERIOD ENDED 30 SEPTEMBER 2015 EXECUTIVE SUMMARY FINANCIAL RESULTS CAPITAL INVESTMENT VOLUMES AND OPERATIONS HUMAN CAPITAL SUSTAINABLE DEVELOPMENT
INTERIM RESULTS FOR THE PERIOD ENDED 30 SEPTEMBER 2015 29 October 2015
AGENDA FOR THE PERIOD ENDED 30 SEPTEMBER 2015 EXECUTIVE SUMMARY FINANCIAL RESULTS CAPITAL INVESTMENT VOLUMES AND OPERATIONS HUMAN CAPITAL SUSTAINABLE DEVELOPMENT CONCLUSION TRANSNET REVIEWED INTERIM RESULTS 1
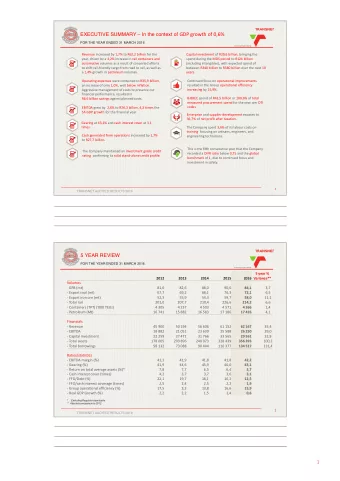
EXECUTIVE SUMMARY FOR THE PERIOD ENDED 30 SEPTEMBER 2015 Cash generated from operations Revenue increased by 6,4% to increased by 11,6% to R15,2 billion. R32,2 billion. Port bulk and break-bulk volumes grew EBITDA increased by 9,0% to by 11,8% to 50,3mt. R13,9 billion. Export iron ore volume growth of 7,5% EBITDA margin increased by 1,3% and containers and automotive volumes from 41,8% in March 2015 to 43,1%. on rail growth of 4,2%. B-BBEE spend of R26,97 billion or 96,5% Gearing at 41,4% and cash interest of Total Measured Procurement Spend cover at 3,0 times. (TMPS) for the period per DTI codes . Capital investment of R16,1 billion, DIFR at 0,65 reflects a stable safety bringing the spend during MDS to record. R108,9 billion. TRANSNET REVIEWED INTERIM RESULTS 2
ACTUAL PERFORMANCE TO DATE FOR THE PERIOD ENDED 30 SEPTEMBER 2015 Sept 2015 vs prior period Weighted group volume performance +0,5% September 2015 volume growth % 6,0 2,3 Revenue +6,4% (1,8) EBITDA * +9,0% Rai l Ports Pipelines Depreciation +19,7% The sharp downturn in economic activity resulted in a drop in volumes handled. Customers downscaling operations. Finance cost +7,6% GDP growth tracking below expectations: 2012 1 st year of MDS 3,8% Net profit for the period (17,1%) 2015 Budget 2,1% Capital investment 2015 BER forecast 1,7% (13,9%) 2015 Minister mini budget 1,5% Cash interest cover (times) ** **** (0,6) **** Gearing *** +1,4% * Including Regulator claw backs. ** Cash interest cover is 3,0 times as at 30 September 2015, and was 3,6 times as at 31 March 2015. *** Absolute variance. **** September 2015 vs March 2015. 3 TRANSNET REVIEWED INTERIM RESULTS
ABRIDGED INCOME STATEMENT Abridged income statement FOR THE PERIOD ENDED 30 SEPTEMBER 2015 2015 % 2014 R million variance R million Revenue 32 228 30 282 6,4 Net operating expenses excluding depreciation, derecognition and (18 325) (17 522) 4,6 amortisation EBITDA 13 903 12 760 9,0 (6 889) 19,7 Depreciation, derecognition and amortisation (5 757) Profit from operations before items listed below 7 014 7 003 0,2 Impairment of assets, fair value adjustments and other items (1 061) (719) 47,6 Net finance costs (3 412) (3 227) 5,7 2 541 (16,9) Profit before taxation 3 057 Taxation (763) (913) (16,4) Profit for the period 1 778 2 144 (17,1) TRANSNET REVIEWED INTERIM RESULTS 4
REVENUE AND VOLUMES Revenue and volumes FOR THE PERIOD ENDED 30 SEPTEMBER 2015 Revenue (R million) Rail volumes (mt) -1,8% 110,5 108,5 +6,4% 32 228 30 282 43,7 41,3 Coal (-5%)* Iron ore and manganese (+6)%* Containers and automotive (+4%)* Mineral mining and chrome (+2%)* 32,9 34,8 Steel and cement (-10%)* 7,2 Agriculture and bulk (-16%)* 7,5 10,3 10,5 10,9 9,8 5,5 4,6 2014 2015 2014 2015 Port c ontainers (‘000 TEUs) Revenue contribution by Operating Division** (%) +2,3% TPL 5 2 342 2 290 TPT 14 50 TFR 16 TNPA 15 2014 2015 TE * Variance % to prior period. ** Excludes specialist units and intercompany eliminations. TRANSNET REVIEWED INTERIM RESULTS 5
OPERATING EXPENSES Operating expenses FOR THE PERIOD ENDED 30 SEPTEMBER 2015 Net operating expenses contribution by Net operating expenses (R million) cost element (%) +4,6% 25 18 325 17 522 54 4 17 21 2014 2015 Personnel costs Material and maintenance costs Energy costs Other operating expenses The operating cost increase was limited to 4,6% in line with inflation, to R18,3 billion in spite of a 9,6% increase in personnel costs to R9,8 billion and a 4,3% increase in electricity costs. The cost increase was contained by numerous cost-reduction initiatives, which resulted in a R3,1 billion saving against planned costs. TRANSNET REVIEWED INTERIM RESULTS 6
EBITDA EBITDA FOR THE PERIOD ENDED 30 SEPTEMBER 2015 EBITDA contribution by Operating Division** (%) EBITDA (R million) +9,0% 13 903 12 760 TPL 10 TPT 11 50 TFR 2014 2015 EBITDA margin (%) 27 TNPA * +1,0% 43,1 2 42,1 TE EBITDA growth of 9,0% well above GDP growth of 1,5%. 2014 2015 * Absolute variance. ** Excludes specialist units and intercompany adjustments. TRANSNET REVIEWED INTERIM RESULTS 7
DEPRECIATION, IMPAIRMENT, FINANCE COSTS AND NET PROFIT FOR THE PERIOD ENDED 30 SEPTEMBER 2015 Depreciation, derecognition and amortisation (R million) Depreciation, derecognition and amortisation of assets for the period increased +19,7% by 19,7% to R6,9 billion, due to the depreciation of revalued rail infrastructure, 6 889 port facilities and pipelines as well as the capital investments for the period. This 5 757 trend is expected to continue in line with the execution of the capital investment programme . 2014 2015 Impairment of assets (R million) Impairment of assets, amounting to R744 million relates primarily to property, +13,9% plant and equipment as well as trade and other receivables due to the difficult 744 653 economic environment. The property, plant and equipment impairment pertains mainly to an impairment on the pipeline specifically relating to the coastal terminal accumulator tanks. 2014 2015 Finance costs (R million) +7,6% 3 584 3 331 Finance costs increased by 7,6%, in line with expectations, due to increased borrowings to fund the capital investment programme. 2014 2015 Net profit for the period (R million) -17,1% Accordingly net profit for the period decreased by 17,1%, mainly due: • The downturn in global economic activity affecting volumes handled; 2 144 1 778 • GDP growth expectations dropping from 2,1% to 1,5%; and • Increased depreciation and finance costs due to the intensive capital 2014 2015 investment programme. TRANSNET REVIEWED INTERIM RESULTS 8
ABRIDGED STATEMENT OF FINANCIAL POSITION Abridged statement of financial position FOR THE PERIOD ENDED 30 SEPTEMBER 2015 September 2015 March 2015 R million R million ASSETS Property, plant and equipment 301 053 287 166 Investment properties 9 252 9 074 Other non-current assets 14 422 9 701 Non-current assets 324 727 305 941 Current assets 24 648 22 498 Total assets 349 375 328 439 EQUITY AND LIABILITIES Capital and reserves 146 845 142 328 Non-current liabilities 157 188 145 853 Current liabilities 45 342 40 258 Total equity and liabilities 349 375 328 439 TRANSNET REVIEWED INTERIM RESULTS 9
PROPERTY, PLANT AND EQUIPMENT Property, plant and equipment (PPE) FOR THE PERIOD ENDED 30 SEPTEMBER 2015 Property, plant and equipment (R million) +4,8% (6 774) 3 075 16 085 PPE increased by 4,8% to R301,1 billion, mainly as a result of (284) 1 785 301 053 the capital investment for the period of R16,1 billion, with R6,7 billion being invested in the expansion of infrastructure and equipment, while R9,4 billion was invested in maintaining existing capacity. Transnet is committed to investing in an optimised capital 287 166 portfolio that remains responsive to validated demand . March 2015 Additions Revaluation Depreciation & Borrowing Other Sept 2015 derecognition costs Return on total average assets (excluding CWIP) (%)* ** -1,2% Return on total average assets at 4,8% is due to: 6,0 • The significant increase in the asset base; 4,8 • Volumes not materialising as a result of the downturn in the economy resulting in customers downscaling operations; and • Lower GDP growth, resulting in a lack of demand. March 2015 September 2015 * Includes Regulator claw backs. ** Absolute variance. TRANSNET REVIEWED INTERIM RESULTS 10
TOTAL BORROWINGS Total borrowings FOR THE PERIOD ENDED 30 SEPTEMBER 2015 Total borrowings (R million) +13,3% 125 023 110 377 Transnet raised R12,5 billion for the period and repaid borrowings amounting to R5,3 billion. The 13,3% increase is in line with the funding plan for the capital investment programme. March 2015 September 2015 Gearing (%) * +1,4% 41,4 40,0 The gearing ratio is at 41,4% (March 2015: 40,0%) due mainly to the execution of the capital expenditure programme. This level is still well below the Group’s target range of 50,0%, reflecting the capacity available to continue with the investment strategy. The gearing ratio is not expected to exceed the target ratio over the medium-term. March 2015 September 2015 * Absolute variance. TRANSNET REVIEWED INTERIM RESULTS 11
Recommend


More recommend
Explore More Topics
Stay informed with curated content and fresh updates.