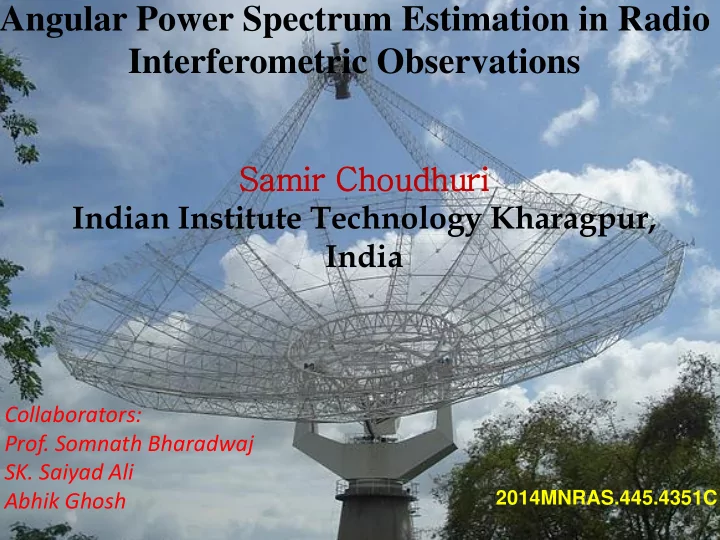

Angular Power Spectrum Estimation in Radio Interferometric Observations Samir Choudhuri Indian Institute Technology Kharagpur, India Collaborators: Prof. Somnath Bharadwaj SK. Saiyad Ali 2014MNRAS.445.4351C Abhik Ghosh
Radio Interferometers: Visibilities Direction to the source d U T2 T1 d Correlator Field of view of the antenna – Small – Plane parallel approx. 2 iU . 2 V ( U , v ) A ( ) I ( ) e d Antenna beam pattern Intensity distribution
Giant Metrewave Radio Telescope, Pune,India 30 fixed antennas x 45m diameter It is currently operating at several frequency band in the frequency range 150 -1420 MHz
Foregrounds Point Sources Diffuse GMRT 150MHz Observation Ghosh et al. 2012
Motivation How to quantify these fluctuations ?
Angular Power Spectrum Any brightness temperature fluctuation on the sky are usually described by an expansion in spherical harmonics. The Angular Power Spectrum defined as : * C a ( ) a ( ) l lm lm
How they are related? Entire Sky Signal Two Visibility Correlation: Noise bias can be avoided by excluding self-correlation term.
Simulation Bare Estimator Estimators Tapered Gridded Estimator Results
Simulation
Simulation We generate the , Ghosh et al. 2012 Then we use FFT to generate in the image plane. Simulations has been done considering GMRT 150 MHz Observations.
Diffuse Emission (sky plane)
GMRT Baseline Distribution V U
Estimators
Bare Estimator The Bare Estimator is defined as 0.76 For GMRT , σ 0 =16.6 Correlation length, 0 FWHM
Bare Estimator
Disadvantage: The Bare Estimator deals directly with the visibilities and the computational time for the pairwise correlation scales proportional to N 2 , where N is the total number of visibilities in the data.
Tapered Gridded Estimator We define tapered Gridded Estimator as, θ in arc-min
Tapered Gridded Estimator
Why Overestimate?
Random UV Distribution V U
Tapered Gridded Estimator
Instrumental Effect (a) Gain Error (b) W-term Effect
Gain Error
The W-term Effect
SUMMARY 1.We have introduced two estimators for quantifying the angular power spectrum of the sky brightness temperature. We find that the Bare Estimator is able to recover the input model to a good level of precision. For the GMRT estimated angular power spectrum from the Tapered Gridded Estimator is largely within the 1σ errors from the input model. 2.We studied the effect of gain error and find that expectation value of the estimators only depends on the phase error. 3.We find that the w-term does not cause a very big change in the estimated C ℓ at the scales of our interest.
THANK YOU
Recommend
More recommend