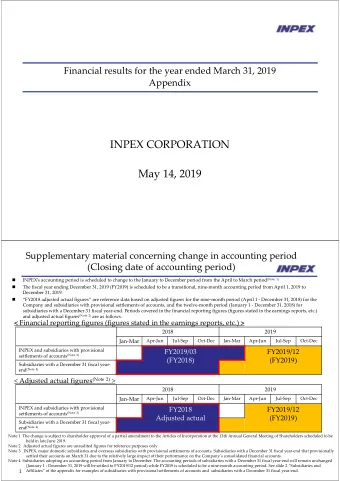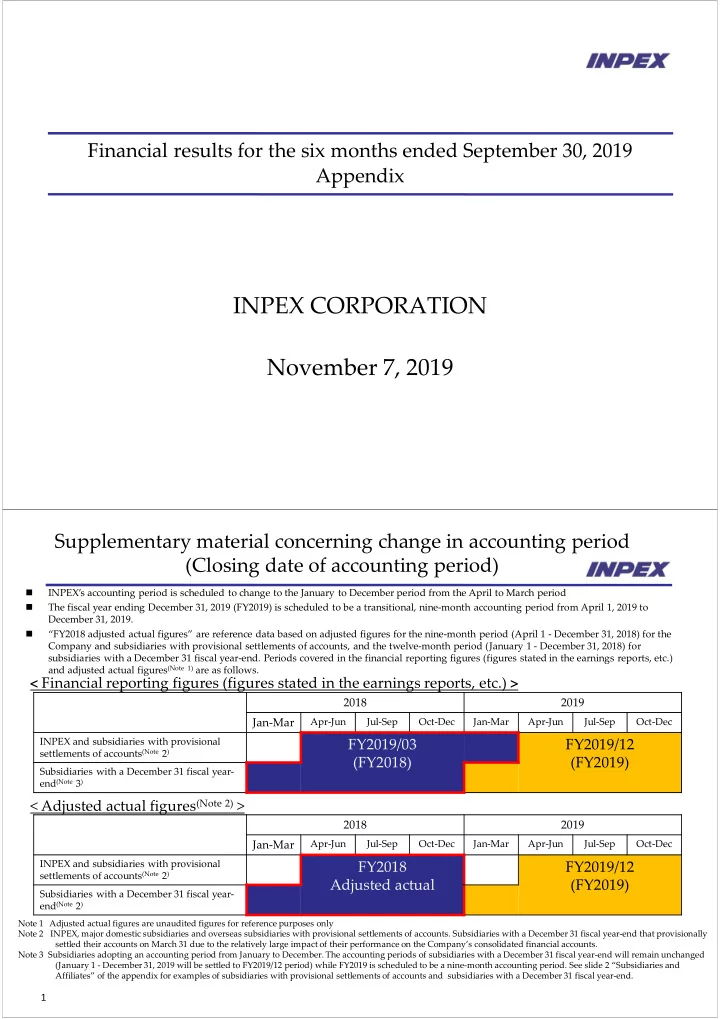
Financial results for the six months ended September 30, 2019 Appendix INPEX CORPORATION November 7, 2019 Supplementary material concerning change in accounting period (Closing date of accounting period) INPEX’s accounting period is scheduled to change to the January to December period from the April to March period The fiscal year ending December 31, 2019 (FY2019) is scheduled to be a transitional, nine ‐ month accounting period from April 1, 2019 to December 31, 2019. “FY2018 adjusted actual figures” are reference data based on adjusted figures for the nine ‐ month period (April 1 ‐ December 31, 2018) for the Company and subsidiaries with provisional settlements of accounts, and the twelve ‐ month period (January 1 ‐ December 31, 2018) for subsidiaries with a December 31 fiscal year ‐ end. Periods covered in the financial reporting figures (figures stated in the earnings reports, etc.) and adjusted actual figures (Note 1) are as follows. < Financial reporting figures (figures stated in the earnings reports, etc.) > 2018 2019 Jan ‐ Mar Apr ‐ Jun Jul ‐ Sep Oct ‐ Dec Jan ‐ Mar Apr ‐ Jun Jul ‐ Sep Oct ‐ Dec INPEX and subsidiaries with provisional FY2019/03 FY2019/12 settlements of accounts (Note 2 ) (FY2018) (FY2019) Subsidiaries with a December 31 fiscal year ‐ end (Note 3 ) < Adjusted actual figures (Note 2) > 2018 2019 Jan ‐ Mar Apr ‐ Jun Jul ‐ Sep Oct ‐ Dec Jan ‐ Mar Apr ‐ Jun Jul ‐ Sep Oct ‐ Dec INPEX and subsidiaries with provisional FY2018 FY2019/12 settlements of accounts (Note 2 ) Adjusted actual (FY2019) Subsidiaries with a December 31 fiscal year ‐ end (Note 2 ) Note 1 Adjusted actual figures are unaudited figures for reference purposes only Note 2 INPEX, major domestic subsidiaries and overseas subsidiaries with provisional settlements of accounts. Subsidiaries with a December 31 fiscal year ‐ end that provisionally settled their accounts on March 31 due to the relatively large impact of their performance on the Company’s consolidated financial accounts. Note 3 Subsidiaries adopting an accounting period from January to December. The accounting periods of subsidiaries with a December 31 fiscal year ‐ end will remain unchanged (January 1 ‐ December 31, 2019 will be settled to FY2019/12 period) while FY2019 is scheduled to be a nine ‐ month accounting period. See slide 2 “Subsidiaries and Affiliates” of the appendix for examples of subsidiaries with provisional settlements of accounts and subsidiaries with a December 31 fiscal year ‐ end. 1
Subsidiaries and Affiliates 64 consolidated subsidiaries Major subsidiaries Country/region Ownership Stage Accounting term March (provisional Japan Oil Development Co., Ltd. UAE 100% Production settlement of account) JODCO Onshore Limited UAE 51 % Production December JODCO Lower Zakum Limited UAE 100% Production December INPEX Sahul, Ltd. Timor ‐ Leste 100% Production December March (provisional INPEX Ichthys Pty Ltd Australia 100% Production settlement of account) March (provisional INPEX Southwest Caspian Sea, Ltd. Azerbaijan 51% Production settlement of account) March (provisional INPEX North Caspian Sea, Ltd. Kazakhstan 51% Production settlement of account) INPEX Oil & Gas Australia Pty Ltd Australia 100% Production December 21 equity method affiliates Major affiliates Country/region Ownership Stage Accounting term MI Berau B.V. Indonesia 44% Production December Angola Block 14 B.V. Angola 49.99% Production December March (provisional Ichthys LNG Pty Ltd Australia 66.245% Production settlement of account) 2 Segment information For the six months ended September 30, 2019 (April 1, 2019 through September 30, 2019) (Millions of yen) Reportable segments Eurasia Adjustments *1 Consolidated *2 Asia & Middle East Japan (Europe & Americas Total Oceania & Africa NIS) Net sales 62,828 149,059 43,736 314,761 6,545 576,930 (1,661) 575,269 Segment income 12,158 72,657 10,846 200,686 (6,888) 289,461 (8,745) 280,715 (loss) Note: 1. Adjustments of segment income of ¥(8,745) million are corporate expenses. Corporate expenses are mainly amortization of goodwill that are not allocated to a reportable segment and general administrative expenses. 2. Segment income is reconciled with operating income on the consolidated statement of income. 3
LPG Sales Apr. ‐ Sep. ’18 Apr. ‐ Sep. ’19 Change %Change Net sales (Billions of yen) 0.4 1.5 1.1 263.2% Sales volume (thousand bbl) 76 151 75 99.2% Average unit price of overseas 50.40 44.86 (5.54) (11.0%) production ($/bbl) Average unit price of domestic 74.76 67.89 (6.87) (9.2%) production (¥/kg) 0.62yen 0.6% Average exchange rate (¥/$) 108.53 109.15 depreciation depreciation Sales volume by region Apr. ‐ Sep. ‘19 Apr. ‐ Sep. ‘18 Change %Change (thousand bbl) 2 1 (0) Japan (25.8%) (0.1 thousand ton) (0.1 thousand ton) ( ‐ 0.0 thousand ton) Asia & Oceania 74 150 76 101.8% Eurasia (Europe & NIS) ‐ ‐ ‐ ‐ Middle East & Africa ‐ ‐ ‐ ‐ Americas ‐ ‐ ‐ ‐ Total 76 151 75 99.2% 4 Other Income/Expenses (Billions of Yen) Apr. ‐ Sep. ’18 Apr. ‐ Sep. ’19 Change %Change Other income 33.6 12.0 (21.5) (64.1%) Interest income 4.1 1.7 (2.3) (56.7%) Dividend income 1.4 2.2 0.8 58.7% Equity in earnings of affiliates 10.5 4.2 (6.2) (59.6%) Compensation income 7.4 ‐ (7.4) ‐ Foreign exchange gain 5.2 ‐ (5.2) ‐ Other 4.7 3.7 (0.9) (20.9%) Other expenses 13.0 21.6 8.5 65.8% Interest expense 4.7 14.3 9.5 200.1% Provision for allowance for recoverable 1.6 1.9 0.2 12.9% accounts under production sharing Foreign exchange loss ‐ 0.6 0.6 ‐ Other 6.5 4.7 (1.8) (27.9%) 5
EBIDAX (Millions of yen) Apr.–Sep. ’18 Apr. –Sep. ’19 Change Note 34,034 69,487 35,453 Net income attributable to owners of parent P/L Net income (loss) attributable to non ‐ controlling 7,010 1,911 (5,099) P/L interests 55,097 105,770 50,673 Depreciation equivalent amount 41,710 83,047 41,337 Depreciation and amortization C/F Depreciation under concession agreements and G&A Amortization of goodwill 3,380 3,380 ‐ C/F Recovery of recoverable accounts under 10,007 19,343 9,336 C/F Depreciation under PS contracts production sharing (capital expenditures) 2,697 13,551 10,854 Exploration cost equivalent amount 1,007 11,642 10,635 Exploration expenses P/L Exploration expense under concession agreements Provision for allowance for recoverable 1,690 1,909 219 P/L Exploration expense under PS contracts accounts under production sharing 855 496 (359) Material non ‐ cash items 5,210 (1,156) (6,366) Income taxes ‐ deferred P/L (4,355) 1,652 6,007 Foreign exchange loss (gain) C/F Net interest expense after tax 479 9,070 8,591 P/L After ‐ tax interest expense minus interest income 100,172 200,285 100,113 EBIDAX 6 Analysis of Recoverable Accounts under Production Sharing Apr. – Apr. ‐ (Millions of yen) Note Sep. ’19 Sep. ’18 Balance at beginning of the period 589,098 568,059 Add: Exploration costs Mainly Iraq Block10 1,613 1,950 Development costs 11,590 15,893 Mainly ACG, Kashagan and Con Son Operating expenses Mainly ACG and Kashagan 7,719 9,138 Other 5,647 5,396 Less: Cost recovery (CAPEX) 10,007 19,343 Mainly ACG and Kashagan Cost recovery (non ‐ CAPEX) Mainly ACG and Kashagan 20,301 7,853 Other ‐ 2,177 Balance at end of the period Mainly Kashagan 585,361 571,063 83,345 69,765 Less allowance for recoverable accounts under production sharing at end of the period 7
Recommend
More recommend
Unleash a World of Digital Possibilities—Browse, Share, and Explore Content Without Boundaries