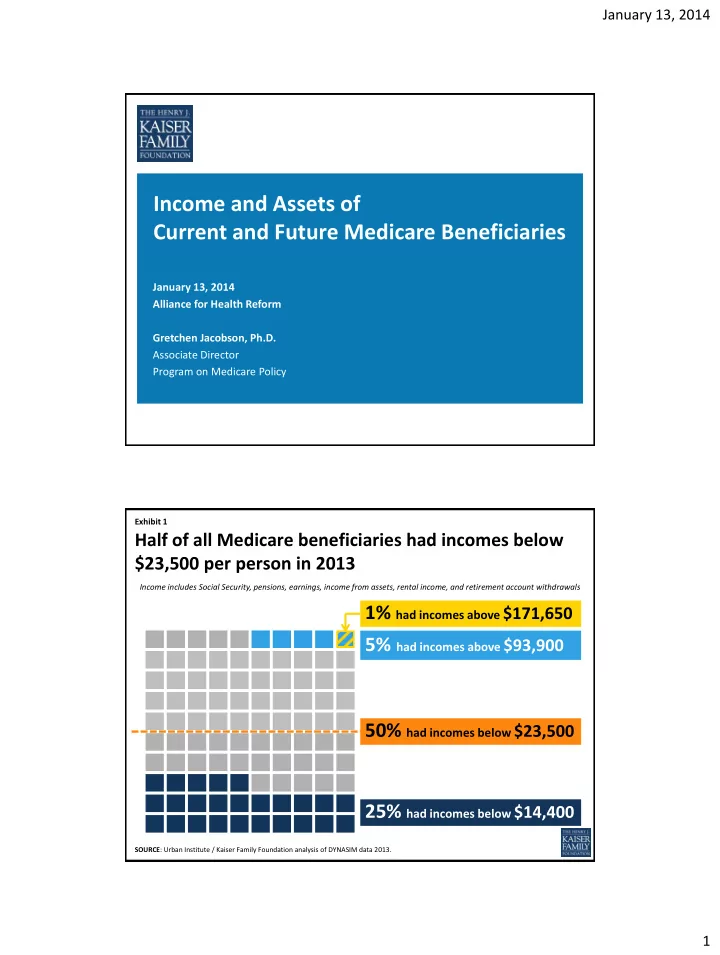

January 13, 2014 Income and Assets of Current and Future Medicare Beneficiaries January 13, 2014 Alliance for Health Reform Gretchen Jacobson, Ph.D. Associate Director Program on Medicare Policy Exhibit 1 Half of all Medicare beneficiaries had incomes below $23,500 per person in 2013 Income includes Social Security, pensions, earnings, income from assets, rental income, and retirement account withdrawals 1% had incomes above $171,650 5% had incomes above $93,900 50% had incomes below $23,500 25% had incomes below $14,400 SOURCE : Urban Institute / Kaiser Family Foundation analysis of DYNASIM data 2013. 1
January 13, 2014 Exhibit 2 Median per capita income among Medicare beneficiaries varies by beneficiary characteristics in 2013 Race/ethnicity Age Marital Status $29,150 $27,400 $26,400 $23,550 $23,500 $21,050 $20,250 $18,000 $17,200 $16,350 $14,150 $13,300 Total White Black Hispanic Under 65 65-74 75-84 85 or older Married Divorced Widowed Single NOTE: Total household income for couples is split equally between husbands and wives to estimate income for married beneficiaries. SOURCE: Urban Institute / Kaiser Family Foundation analysis, 2013. Exhibit 3 Growth in per capita income is projected to be concentrated among beneficiaries with higher incomes Per Capita Total Income (in 2013 dollars) $120,000 $111,900 95 th percentile $93,900 $100,000 $84,100 90 th percentile $80,000 $69,350 $60,000 $51,000 75 th percentile $41,650 $40,000 $28,250 50th percentile (Median) $23,500 $20,000 25 th percentile $16,400 $14,400 $0 2017 2022 2027 2013 2015 2020 2025 2030 Year NOTE: All incomes are adjusted to 2013 dollars. SOURCE: Urban Institute / Kaiser Family Foundation analysis, 2013. 2
January 13, 2014 Exhibit 4 Half of all Medicare beneficiaries had savings below $61,400 per person in 2013 Savings include retirement account holdings (such as IRAs or 401Ks), savings accounts, bonds and stocks 1% had savings above $3,423,800 5% had savings above $1,112,950 5% had savings above $1,112,950 50% had savings below $61,400 50% had savings below $61,400 50% had savings below $61,400 50% had savings below $61,400 50% had savings below $61,400 25% had savings below $11,300 25% had savings below $11,300 25% had savings below $11,300 25% had savings below $11,300 8% had $0 in savings 8% had $0 in savings 8% had $0 in savings or were in debt or were in debt or were in debt SOURCE : Urban Institute / Kaiser Family Foundation analysis of DYNASIM data 2013. Exhibit 5 Median per capita savings among Medicare beneficiaries varies by beneficiary characteristics in 2013 Median per capita Race/ethnicity Age Marital Status savings among all beneficiaries $89,500 $85,500 $80,000 $70,300 $61,400 $55,050 $42,000 $37,000 $28,050 $14,950 $10,300 $9,300 Total White Black Hispanic Under 65 65-74 75-84 85 or older Married Divorced Widowed Single % with 92% 95% 81% 81% 87% 94% 92% 91% 95% 87% 92% 79% savings Median among those $75,200 $99,750 $18,800 $20,750 $37,600 $99,100 $87,300 $50,000 $90,100 $60,200 $68,800 $33,600 with savings NOTE: Total household savings for couples is split equally between husbands and wives to estimate savings for married beneficiaries. SOURCE: Urban Institute / Kaiser Family Foundation analysis, 2013. 3
January 13, 2014 Exhibit 6 Growth in per capita savings is projected to be concentrated among beneficiaries with more savings Per Capita Total Savings, among all beneficiaries (in 2013 dollars) $1,600,000 $1,470,900 95 th percentile $1,400,000 $1,112,950 $1,200,000 $1,000,000 $896,550 90 th percentile $800,000 $619,600 $600,000 $354,100 $400,000 75 th percentile $234,950 $200,000 $101,150 50th percentile (Median) $61,400 $0 2013 2015 2017 2020 2022 2025 2027 2030 Year NOTE: All savings are adjusted to 2013 dollars. SOURCE: Urban Institute / Kaiser Family Foundation analysis, 2013. Exhibit 7 Half of all Medicare beneficiaries had home equity below $66,700 per person in 2013 1% had home equity above $799,850 5% had home equity above $398,500 5% had home equity above $398,500 50% had home equity below $66,700 50% had home equity below $66,700 50% had home equity below $66,700 50% had home equity below $66,700 50% had home equity below $66,700 25% had home equity below $12,250 25% had home equity below $12,250 25% had home equity below $12,250 25% had home equity below $12,250 21% had $0 in home equity 21% had $0 in home equity 21% had $0 in home equity SOURCE : Urban Institute / Kaiser Family Foundation analysis of DYNASIM data 2013. 4
January 13, 2014 Exhibit 8 Key Findings • Most people on Medicare are of modest means, and half lived on less than $23,500 in 2013 – A small share have high incomes • Most people on Medicare have some savings and home equity, but the range of assets among beneficiaries is wide – Half of all Medicare beneficiaries have less than $61,400 savings – Half of all Medicare beneficiaries have less than $66,700 in home equity • Income and assets are projected to be somewhat greater among the next generation – Much of the growth is projected to be realized among the upper income and asset levels – Median income and assets expected to rise, but only modestly 5
Recommend
More recommend