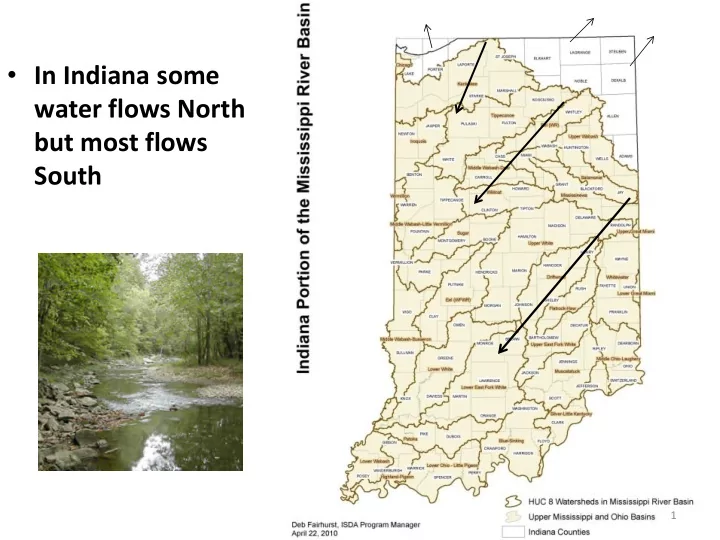

• In Indiana some water flows North but most flows South 1
Toledo = Harmful Algal Bloom
3
Source: USGS SPARROW Model
Source: USGS SPARROW Model
Urgency: Gulf Restoration Network vs. EPA Des Moines Water Works vs. Counties Source: Bloomberg Source: Iowa Farmer Today
Chesapeake Bay: The Largest Total Maximum Daily Load (TMDL) in history - 2010 TMDL = “Pollution Diet” Comprised of 92 smaller TMDLs within the Bay Watershed Based on 7 Watershed Implementation Plans • 6 Bay States (NY, PA, MD, WV, DE, VA) and Washington DC • Whole Bay Estimated Costs: $35 billion to $80 billion by 2025
Telling the Conservation Story Past (Performance Based) Future (Outcome Based) • How do voluntary • # of conservation practices conservation efforts directly installed improve water quality? • Acres treated • Further….how do BMP’s • Length of practices installed reduce Nitrogen, • Millions of dollars (FARM Phosphorus, and Sediment from entering waters of the Bill) spent State? • Etc. • Furthermore….are we directly targeting priority/sensitive areas?
Conservation funding for all practices transparent by county in.gov/isda/icpreports SWCD Generated Success Story Funding Break down/county
Indiana Conservation Partnership Annual (CY) Workload Accountability Data Flow ISDA/SWCD DNR DATA Original Data Source FSA DATA NRCS DATA IDEM DATA DATA LARE Data Server Location CRP FARM BILL* EPA – 319 AGENCY POINT OF CREP & CWI Indianapolis Kansas City Washington D.C. Indianapolis CONTACT DOUG Indianapolis SUSAN CHRIS MORSE LOU RENSHAW NUSBAUM DEB FAIRHURST HOVERMALE DATA SPRING/FALL CONSOLIDATION ICP FINANCIAL REPORTS TILLAGE TRANSECT WEB APPLICATION*** DATA*** & QUALITY http://www.in.gov/isda/icpreports/ http://www.in.gov/isda CONTROL FSA DATA (Total Funding By County) (Tillage Trends By County) (Separate Data Flow Process) CRP (Separate Data Flow Process) DEB FAIRHURST SUSAN ISDA HOVERMAL E QUARTERLY REGION 5 MODEL (CY) EPA ANNUAL ICP ANNUAL REGION DATA REGION 5 CONSERVATION 5 MODEL LOAD CONSOLIDATION WORKLOAD LOAD REDUCTION & QUALITY REPORT*** MAPS*** REDUCTION (By County) CONTROL (By Watershed) MODELING** DEB FAIRHURST ISDA STAFF ISDA PUBLISHED TO ISDA & ICP PUBLISHED TO ISDA & ICP WEBSITES WEBSITES *Data Sharing Privacy Agreements are in place http://www.in.gov/isda http://www.in.gov/isda ** http://it.tetratech-ffx.com/steplweb/models$docs.htm http://iaswcd.org/icp/ http://iaswcd.org/icp/ ***Incorporated into the Indiana Nutrient Reduction Strategy Last updated 9/25/14
30,775 NEW conservation practices COMPLETED in 2013
Example: Agricultural Gully Erosion (Before)
Example: Grassed Waterway BMP (After) Load reduction modeling accounting for before and after conditions conducted. Estimates pounds of N, P, and Sediment kept on Ag fields and out of waterways.
3,323,272,000 lbs
Thoughts For Further Consideration • How does the county or watershed(s) you work in compare to others in the state? – Are there more or fewer practices being completed? – Why is this? • Should we focus more on what Ag is reducing rather than contributing? – After all food production benefits the larger population. • If a practice isn’t recorded it never happened • Think in terms of Outcomes (The difference we make) rather than just Outputs (What we do)
Recommend
More recommend