ILLINOIS Motivati tion: Bug Reproduction is Difficult Especially - PowerPoint PPT Presentation
Replay Debugging: Leveraging Record and Replay for Program Debugging Nima Honarmand and Josep Torrellas University of Illinois at Urbana-Champaign http://iacoma.cs.uiuc.edu/ 1 ILLINOIS Motivati tion: Bug Reproduction is Difficult Especially
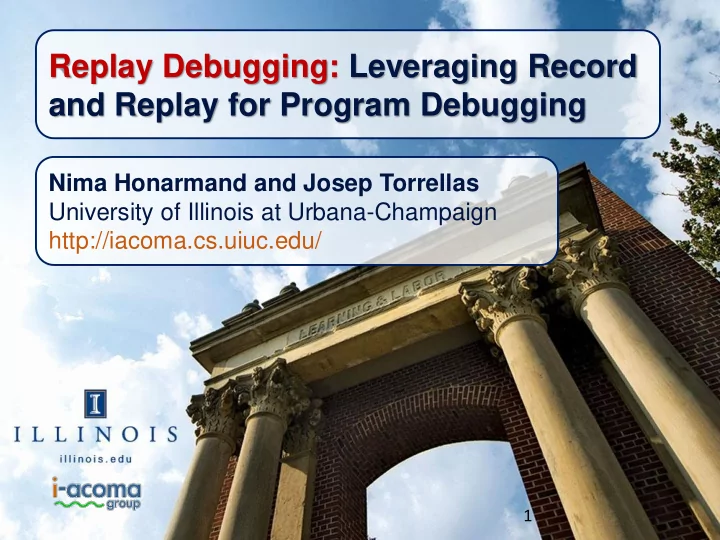
Replay Debugging: Leveraging Record and Replay for Program Debugging Nima Honarmand and Josep Torrellas University of Illinois at Urbana-Champaign http://iacoma.cs.uiuc.edu/ 1 ILLINOIS
Motivati tion: Bug Reproduction is Difficult Especially for bugs in production runs Due to − Complex inputs − Non-deterministic timing in concurrent programs Record and Deterministic Replay ( RnR ) can help − Recreates execution of a program − Record : capture non-deterministic events in a log − Replay : use the log to recreate the exact same execution Problem: Current RnR solutions are not quite suitable as debugging tools. “Replay Debugging” ILLINOIS Nima Honarmand and Josep Torrellas #2
RnR Logs in QuickRec [ISCA’13] Captured in OS kernel Input Log : Program/OS interactions − System call results − Data copied to application buffers by OS kernel − Signals, … Memory Access Interleaving Log − Inter-thread dependences Captured using special HW Interleaving Log Execution WR X WR X RD X RD X WR Y Chunk content RD Y WR Y recorded as Chunk-based # of instructions Recording in the chunk RD Y “Replay Debugging” ILLINOIS Nima Honarmand and Josep Torrellas #3
Problem lem: Naïve RnR not Enough for Debugging Replay only reproduces the Replay Debugging : buggy execution Augment the code and still be able to replay the log Program Log . . . Program Log . . . Bug Found !!! . . . . . . Debug code 3 . . . . . . Debug code 2 . . . X Crash Debug code 1 . . . Not enough! need to augment X Crash the code for diagnosis Augmented code cannot be Enables fast & deterministic replayed using the recorded log: convergence to the source of – Different input events the bug – Different sequence of insts “Replay Debugging” ILLINOIS Nima Honarmand and Josep Torrellas #4
Effective Bug Diagnosis …Needs the ability to − Write debug code as if part of the same program (may be inlined with main code) int a = /* program code */; #ifdef DEBUG printf (“a is %d”, a); #endif − Access main program state − Call main program functions − Output results of debug code − Have debug-only state in the debug code, e.g., Local and global variables, heap-allocated objects, shadow data structures How to enable all of this without breaking replay? “Replay Debugging” ILLINOIS Nima Honarmand and Josep Torrellas #5
Contributi tion: Replay DeBugging (RDB) • A methodology for guaranteed deterministic replay in presence of debug code → One can debug a non-deterministic bug deterministically • A design combining compiler technology + replay mechanisms • Implementation using LLVM and Intel’s Pin • Seamless debugging experience for the programmer − RDB debug code very similar to ordinary debug code “Replay Debugging” ILLINOIS Nima Honarmand and Josep Torrellas #6
RDB Approach: Overall View 3. Executing 1. Writing 2. Extracting Debug Code Debug Code Debug Code While Replaying Programmer adds Compiler extracts debug code Replay tool debug code to and generates two binaries automatically − One contains original, program source invokes debug code unmodified code code at correct − Other contains the debug points while code replaying the log Modified LLVM Compiler “Replay Debugging” ILLINOIS Nima Honarmand and Josep Torrellas #7
1. Programmer Writes Debug Code Debug Code: Should be marked using special markers To guarantee replay Can read main program state remains deterministic Can invoke main program functions Should not write to main program state (directly or indirectly) Can have its own state (local, global and heap) Use the same virtual address space as the main code − E.g., debug vars can point to main data Can use runtime library functions − E.g., printf() or malloc() from libc − Will have its own instance of runtime libs during replay “Replay Debugging” ILLINOIS Nima Honarmand and Josep Torrellas #8
2. Compiling the Augmented Code LLVM IR-Level LLVM C/C++ Clang LLVM Transformations LLVM Machine CodeGen Code Front-end IR and IR Code Backend (x86) Optimizations LLVM Compiler Flow Front-end creates unoptimized LLVM IR from source code Optimizer transforms LLVM IR to optimized form − We assume all optimizations are disabled for now CodeGen generates machine code We modify the last two “Replay Debugging” ILLINOIS Nima Honarmand and Josep Torrellas #9
2.1. Generating Initial LLVM IR No Changes to the LLVM C/C++ Clang LLVM LLVM IR-level LLVM Machine CodeGen Code Front-end IR Transformations IR Code Front-end Backend (x86) @.str = “c is '%c'\n ” void @main() { void main(void) { %c = alloca i8 char c; %_tmp0 = call @getchar() c = getchar(); Clang store %_tmp0, %c rdb_begin Front-end call @__rdb_begin() printf("c is '%c'\n", c); %_tmp1 = load %c rdb_end call @printf(@.str, %_tmp1) } call @__rdb_end() } Instrumented C Code LLVM IR “Replay Debugging” ILLINOIS Nima Honarmand and Josep Torrellas #10
2.2. Extracting the Debug Code Extract the debug LLVM C/C++ Clang LLVM LLVM IR-level LLVM Machine CodeGen Code Front-end IR Transformations IR Code code Backend (x86) @.str = “c is '%c' \ n” Extracted Debug void @__rdb_func_1(i8* %arg) { %_tmp1 = load %arg Code @.str = “c is '%c'\n ” call @printf(@.str, %_tmp1) (LLVM IR) } void @main() { %c = alloca i8 void @main() { Extracted %_tmp0 = call @getchar() %c = alloca i8 LLVM IR-Level store %_tmp0, %c Main Code %_tmp0 = call @getchar() Transformations call @__rdb_begin() store %_tmp0, %c (LLVM IR) %_tmp1 = load %c call @llvm.rdb.location(1) call @printf(@.str, %_tmp1) call @llvm.rdb.arg(1, 0, %c) call @__rdb_end() } } FuncID FuncName Function LLVM IR (from Front-end) Descriptors 1 __rdb_func_1 … 2 (C++) “Replay Debugging” ILLINOIS Nima Honarmand and Josep Torrellas #11
2.3. Generating Machine Code Generate Machine LLVM C/C++ Clang LLVM LLVM IR-level LLVM Machine CodeGen Code Front-end IR Transformations IR Code Code Backend (x86) @.str = “c is '%c' \ n” LLVM void @__rdb_func_1(i8* %arg) { CodeGen Debug Code %_tmp1 = load %arg Backend (x86 object file) call @printf(@.str, %_tmp1) (x86) } Extracted Debug Code (LLVM IR) Main Code (x86) + void @main() { Symbols for %c = alloca i8 LLVM %_tmp0 = call @getchar() Location Markers CodeGen store %_tmp0, %c Backend call @llvm.rdb.location(1) FuncID Position Class Info call @llvm.rdb.arg(1, 0, %c) (x86) 1 0 Stack (SP, -20) } … … 2 0 Extracted Main Code (LLVM IR) … … 2 1 Argument Descriptors (C++) “Replay Debugging” ILLINOIS Nima Honarmand and Josep Torrellas #12
3. Replay Tool Invokes Debug Code Replay implemented using Intel’s Pin (similar to QuickRec) Virtual Address Space − A binary instrumentation Pintool Space infrastructure Static Code Data Heap Anatomy of Pin Stack Libraries − Program and Pintool in the same address space Program Space − Pintool is use-case specific Static Code Data Heap Stack Libraries Our pintool, RdbTool, does two things: − Replays the log − Invokes debugging code “Replay Debugging” ILLINOIS Nima Honarmand and Josep Torrellas #13
3. Replay Tool Invokes Debug Code To replay, RdbTool − Instruments system calls to inject program inputs − Counts # of insts to enforce recorded interleaving RdbTool core logic (C++) To invoke debug code, compile debug code into RdbTool C/C++ Extracted RdbTool Compiler Debug Code Binary RdbTool then & Linker (x86) − Sets breakpoints at debug markers Function/Arg − Finds and invokes debug code using Descriptors (C++) Function and Argument descriptors “Replay Debugging” ILLINOIS Nima Honarmand and Josep Torrellas #14
3. Replay Tool Invokes Debug Code Loads the main code; links it Invoke with runtime libraries Virtual Address Space Debug Funcs Log RdbTool Space Loads the RdbTool; links it with Static Data separate runtime libraries Code Heap Stack Libraries Control Replays the main code & Replay invokes debug code on hitting Main Program Space a debug marker Static Data Code Heap Stack Libraries Execution is the same as recorded in the log “Replay Debugging” ILLINOIS Nima Honarmand and Josep Torrellas #15
Problem with Compiler Optimizations Optimizations will be performed after extracting void f() { char c = getchar(); debug code int a = c ? 5 : 6; printf (“c is %d \ n”, c); rdb_begin May render the debug code printf (“a is %d \ n”, a); invalid rdb_end − E.g., may optimize away } state needed by the debug code Work in progress… “Replay Debugging” ILLINOIS Nima Honarmand and Josep Torrellas #16
Also in the Paper • Real example of bug diagnosis with RDB • Support for event-driven debugging (watch points) • Enforcing read-only access to main- program’s memory • Using gdb together with RDB • Replay debugging without Pin • … “Replay Debugging” ILLINOIS Nima Honarmand and Josep Torrellas #17
Conclusions Naïve RnR not enough for bug diagnosis Replay Debugging: A methodology for guaranteed deterministic replay in presence of debug code • Seamless debugging experience for programmer • Combines compiler and replay technology • Proof-of-the-concept implementation using LLVM and Pin With RDB, one can diagnose a non-deterministic bug deterministically “Replay Debugging” ILLINOIS Nima Honarmand and Josep Torrellas #18
Recommend
More recommend
Explore More Topics
Stay informed with curated content and fresh updates.
