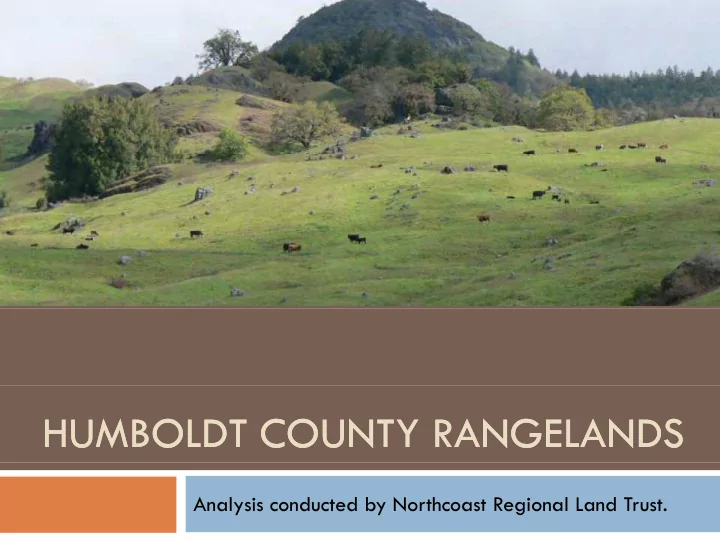

HUMBOLDT COUNTY RANGELANDS HUMBOLDT COUNTY RANGELANDS Analysis conducted by Northcoast Regional Land Trust.
Questions Asked Questions Asked • What is the productive of capacity of rangelands for What is the productive of capacity of rangelands for beef, dairy and produce? • How do revenues relate to the cost of land for purchase or lease? • Are local producers planning for succession ? • How do regulations affect Ag lands? • What is the impact of public acquisitions on p p q bottomlands productivity? • What could sea level rise mean for bottomlands? North Coast Dialogues Rangelands Analysis
Existing Existing Rangelands Rangelands Rangelands Rangelands 487,000 acres Includes: I l d • 12% in bottomlands (60,000) • 88% in uplands (427 000) 88% in uplands (427,000) • 86% private (419,000) • 14% public (68,000) North Coast Dialogues Rangelands Analysis
Uplands Uplands Rangelands Rangelands Rangelands Rangelands 427,000 acres • 85% is privately owned 85% i i l d • Supports approximately 1 cow/30 acres (or 0 03 1 cow/30 acres (or 0.03 cows/acre) • Total carrying capacity = approx14,000 head in uplands North Coast Dialogues Rangelands Analysis
Bottomlands Bottomlands Rangelands Rangelands Rangelands Rangelands 60,000 acres • 92% is privately owned 92% i i l d • Supports approximately 1 cow/acre 1 cow/acre • Total carrying capacity = Total carrying capacity 60,000 head in bottomlands North Coast Dialogues Rangelands Analysis
Productive Capacity Productive Capacity for Beef and Dairy for Beef and Dairy for Beef and Dairy for Beef and Dairy 19% • Capacity of Uplands = 14,000 head Capacity of Uplands 14,000 head (thirty acres/cow) • Capacity of Bottomlands = 60 000 head Capacity of Bottomlands 60,000 head 81% 81% (one acre/cow) • Total Capacity = 74 000 head Total Capacity = 74,000 head NOTE: 81% of the carrying capacity exists on 12% of the rangelands. % g NOTE: Historic Average (10-yr) = 50,000 head (67% of capacity) 50,000 head (67% of capacity) North Coast Dialogues Rangelands Analysis
Threats to Rangeland Productivity Threats to Rangeland Productivity Per Acre Gross Revenue Generation vs. e c e G oss e e ue Ge e a o s. Price of Land in Bottomlands $4,500 $4,000 $4,000 Market Milk M k Milk $3,500 $3,000 Bottomlands Beef $2 500 $2,500 $2,000 Humboldt Creamery Organic $1,500 Annual Mortgage Annual Mortgage $1 000 $1,000 $500 Annual Lease $0 North Coast Dialogues Rangelands Analysis
Other Threats to Rangeland Productivity Other Threats to Rangeland Productivity • No heir to continue their Ag operations No heir to continue their Ag operations 37% of dairy producers, 27% of beef cattle producers, 65% of farmers • No estate plan to protect their land No estate plan to protect their land 65% of producers do not have an estate plan in place. • May sell their land within 15 years • May sell their land within 15 years 42% of dairy producers, 25% of beef cattle producers, 36% of farmers • Regulations R l ti 50% of producers agree that regulations have forced them to consider selling their land or retiring. 73% agree that regulations limit their ability to make business and land North Coast Dialogues improvements to their Ag operations.
Private Bottomlands Private Bottomlands 55,000 acres (92% of total bottomlands) • 63% exists in ownerships smaller than 160 acres. 63% i i hi ll h 160 • 7% exists in ownerships larger than 600 acres. • Carrying Capacity = • Carrying Capacity = 55,000 head North Coast Dialogues Rangelands Analysis
Public Public Bottomlands Bottomlands Bottomlands Bottomlands 4,958 acres • 41% is State owned. 41% i S d • 29% is Federally owned. • 17% is City owned • 17% is City owned. • Carrying Capacity = 4,958 head 4,958 head North Coast Dialogues Rangelands Analysis
Public Public Public ownership represents 8% of the Bottomlands Bottomlands Bottomlands Bottomlands Bottomlands carrying capacity. Production has Bottomlands carrying capacity. Production has been decreased by 47% on those lands which could have generated approximately $1.2 g pp y 4,958 acres million in annual revenue. T Total acres l A Acres Out of Production* O f P d i * State 2,031 1320 Federal 1,457 300 City 819 107 County 531 531 Tribal 120 120 TOTAL: 4,958 2,378 *Approximation based on best data available North Coast Dialogues
Projected Sea Projected Sea L L Level Rise Level Rise l Ri l Ri Note: projections do not account for existing infrastructure such as levee systems infrastructure such as levee systems. North Coast Dialogues Rangelands Analysis
Recommend
More recommend