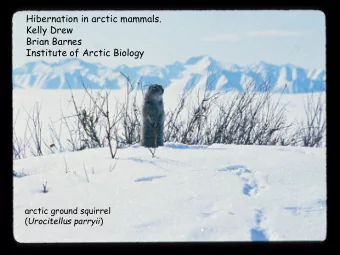
How & Why is the Arctic Changing? -> Integrate IASOA datasets - PowerPoint PPT Presentation
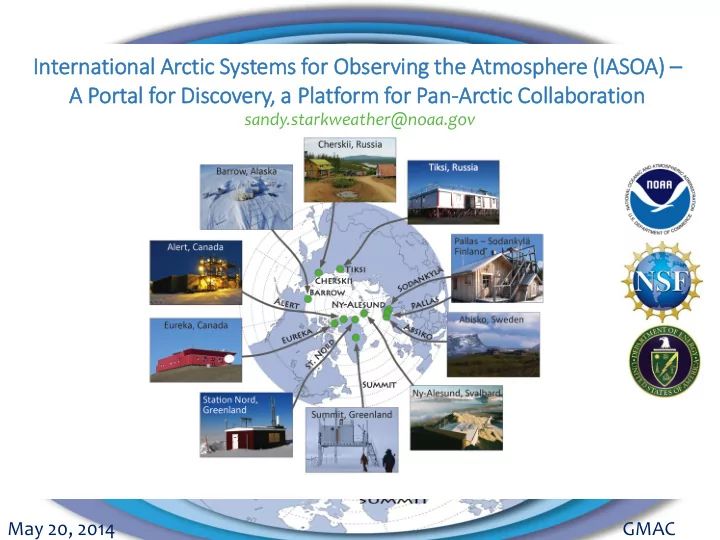
Inter ternational A Arctic S System ems f for O Obser erving t g the A e Atmospher ere e (IASOA) ion A A Por ortal f l for D Dis iscovery, a a Pla latform f for Pa Pan-Arctic ic C Collab labor oration
Inter ternational A Arctic S System ems f for O Obser erving t g the A e Atmospher ere e (IASOA) – ion A A Por ortal f l for D Dis iscovery, a a Pla latform f for Pa Pan-Arctic ic C Collab labor oration sandy.starkweather@noaa.gov May 20, 2014 GMAC
How & Why is the Arctic Changing? -> Integrate IASOA datasets and experts in sustained science collaborations NCEP-NCAR Composite mean air temperature anomalies (1000mb); 2001-2012 compared to 1971- 2000. NOAA/ESRL – PSD. Image with help from B. DeLuisi & Cathy Smith May 20, 2014 GMAC May 12, 2014 PSD-Flash
Integrating across Time, Geography and Process with Arctic Observatories Records reaching 10 back 30+ Locations: years Coastal, Social Integration: Estuary Time Zones, 1000+ Datasets Continental, Languages, Cultures, in Atmospheric Ice Sheet, Expertise, National Physics & High Elev. Needs & Priorities Chemistry, Cryospheric, Ecological
Image with help from – B. DeLuisi Web development – C. Kreuzter
Data Access Portal (cross-site inventory) - Populated with structured, machine-readable metadata - Information organized in “IASOA context” -------- Atm Physics, Chem, Surface ------------- -------- Pan-Arctic, Ground-Based, Long-Term -------------
Portal Population (800+ metadata files) (~400) Harvested from major archives (as is) (~200) Working with archives on structure (~200) Hand Authored
4 Search Results
Emphasize Attribution
Emphasize Access
World Data Center Contributions
GMD Data Finder
Summit, Greenland 50 m - Identify interests and gaps - Identify observing systems Cherskii & datasets of interest 35 m - Identify collaborators and Ny-Alesund 30 m experts - Develop common Tiksi approaches to data 20 m processesing (e.g. GAW) - Develop common error Eureka estimates 10 m Alert 2 m Images courtesy T. Uttal, R. Albee, M. Okraszewski
- Address Arctic-specific challenges - Take regional factors into account (e.g. exceptionally clean air, frost and rime) - Address deficiencies, improve network fitness Images courtesy Rob Albee May 20, 2014 GMAC
Comparison between historical radiometers and new NOAA suite revealed error issues. Large observatories have a lot of diagnostic tools, e.g. AERI Images courtesy C. Cox and N. Miller. Data: NOAA, NSF-ICECAPS, ETH, DOE-ARM. Rob Albee.
- Analyze and synthesize - Improve the metadata - REPEAT with new questions, diversified expertise (e.g. cal-val) Image courtesy B. Stone May 20, 2014 GMAC
IASOA Portal and Collaboration Summary Data is discoverable and accessible • with machine-readable metadata Highly leveraging existing networks • Reliant on humans to maintain & • improve data/metadata “Collaboratory” Cycle – Context • provides impetus Benefits improved network fitness • May 20, 2014 GMAC May 12, 2014 PSD-Flash
THANK YOU. Questions?
Recommend


More recommend
Explore More Topics
Stay informed with curated content and fresh updates.