Hidden Benefits of End-of-Pipe Waste Treatment Nilanjana Dutt & Andrew King Duke University & Tuck School of Business Alliance for Research on Corporate Sustainability May 11, 2011
My Research • Organizational Search – How firms decide where to search for information i.e. search space • Utility companies expanding into renewable electricity – Survey combined with archival data
Connection to this Research • Organizational Search – How firms decide where to search for information? – What affects selection + use of information? • organizational conditions • accidents and spills
Our goals for this talk • Are we correctly characterizing previous research? • How can we strengthen the analysis? • Endogeneity threats? • How can we strengthen the conclusions?
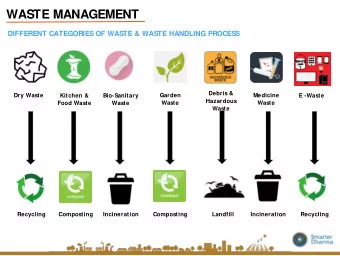
Waste Management 1 Process On site EoP 2 (energy, recycle, treat) 3 Off site
Conceptual Context • Incentives: – Lower incentives for waste reduction as employees can always manage waste at end considered bad for waste reduction (DeCanio, 1993) • Information: – Problem and analysis separated in time, space, and person. (MacDuffie, 1995) But where is the empirical evidence??
Conceptual Context • Failure is an opportunity to improve (Levitt & March 1988, Haunschild et al. 2002, Baum et al. 2007) – Failure directs attention to problem provides feedback to improve – Different organizational conditions lead to different amounts of improvement (Sitkin1992) How do the three waste management options stack up?
Hypothesis • Environmental Management wisdom – Lack of incentives impedes waste reduction On site EoP reduces waste reduction • Organizational Learning wisdom – Feedback increases waste reduction On site EoP increases waste reduction H1: the greater the presence of on-site end of pipe, the greater the waste reduction
Data and Method
Data and Measures • Unbalanced longitudinal panel from 1992-2004 (27,503 facilities constituting 581,902 facility year obs.) – Use EPA’s Toxic Release Inventory at the chemical level – FE at the chemical-facility level; cluster at facility level • DV: improvement: approximately percentage change in waste reduction [(log waste (year t +1)/ log waste(year t))*100] • IV: spill: 0,1 dummy; waste mgmt: dummy measuring two types of waste processing (base case is no management) • Controls: size, age, growth, time since last spill, tenure of officers, EMS certification, time, chemical, facility dummies
What We Expect Pre accident dummies Post accident dummies
Rates of Improvement Year to year improvement: • Facilities with no treatment are increasing waste 6.65%/year • Those with on site treatment are reducing waste by 7.2%/year • Those with off site treatment are reducing waste by 8.27%/year Failure based improvement: • No improvement for no treatment; off site treatment • Significant improvement for on site EoP
Changes Following Accidents
Problems • Endogenity about choice of treatment – Not likely to be an issue based on interviews – Need to create matched sample • Addressed problems – Regression to the mean – Unobserved intention to improve – Within plant effect
Implications • Incentives are important for learning but may be less so than feedback • Firms should choose waste treatment based on: – Need for learning and improvement – Occurrence of failure – Costs of On site EoP vs. Costs of failure?
Questions?
Recommend
More recommend
Unleash a World of Digital Possibilities—Browse, Share, and Explore Content Without Boundaries