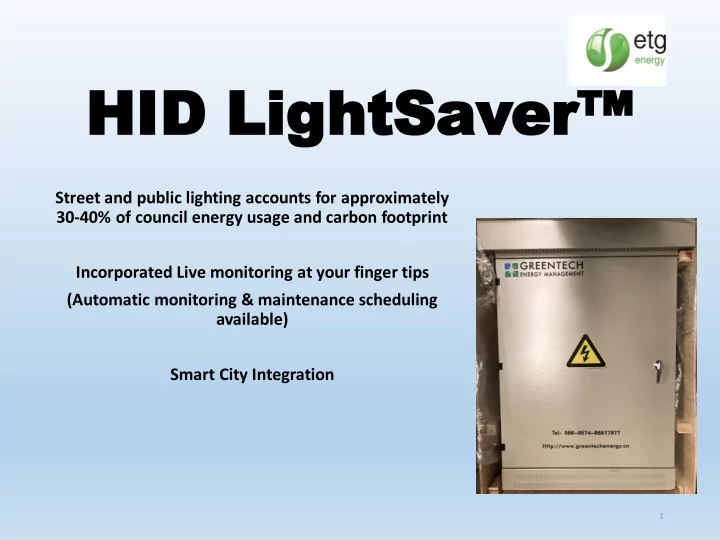

HI HID D Light LightSa Saver er ™ Street and public lighting accounts for approximately 30-40% of council energy usage and carbon footprint Incorporated Live monitoring at your finger tips (Automatic monitoring & maintenance scheduling available) Smart City Integration 1
Pari ris Agreeme ment Reduce emissions by 26% to 28% per cent below 2005 levels by 2030 Meter every energy usage by 2030 Please review the following link; https://www.environment.gov.au/climate- change/publications/fact-sheet-australian-governments- action-climate-change 2
Existi ting Lighti ting Syste tem Existing Distribution Board Street Lighting 3
New w HID Lighti ting Syste tem Existing Distribution HID Unit Board Street Lighting Up to 40% Saving 4
Benefits ts Cost efficient alternative to replacing existing HID lighting to LED lighting installation Immediate reduction of carbon footprint and electricity costs – Up to 40% Savings Up to 10 times more savings with the power usage & CO2 emissions for the same Cap X expenditure as LED replacement Easy integration into Smart City controls system with inbuilt controls Maintains a set recommended lux level Electrical Meter included giving accurate metering of the individual lighting circuit 5
Benefits ts Increases in the lamp life – less repair, replacement and maintenance of bulbs Installation is cheap, quick and easy • 1 unit can cover kilometres of lighting. • No out of hours working Reduction in Maintenance Costs • Increases the Lamp Life • Less Repair, Replacement and Maintenance of bulbs Rapid payback and return on investment 6
Cost t Analysis 1 Circuit (100 lights) Savings Approx No Meter Budget Current Approx Approx Running Average kWhr Current Approx Cap X Budget W/fitting kWhr/day $/year Saving Ratio of fittings Installation cost/fitting CO2 emissions Cost Saving hr/day Reduction CO2 emissions W Tonnes % Tonnes 1.0 LED Replacement 100 $420,000.00 $20,000.00 250 $4,000.00 94.0 76% 12 300 228 $5,825.40 71.4 9.9 HID Lightsaver 2,100 $420,000.00 250 $200.00 94.0 36% 12 6300 2268 $57,947.40 336.6 4 Circuits together (60 lights each) Savings No of Meter Budget Approx CO2 Approx Running Average kWhr Approx CO2 Cap X Budget W/fitting kWhr/day $/year Saving Ratio fittings Installation cost/fitting emissions Cost Saving hr/day Reduction emissions W Tonnes % Tonnes 1.0 LED Replacement 240 $980,000.00 $20,000.00 250 $4,000.00 225.6 76% 12 720 547.2 $13,980.96 171.5 HID Lightsaver 240 $48,000.00 250 $200.00 225.6 36% 12 720.0 259.2 $6,622.56 38.5 0.5 7
Applicati tions • Street lighting • Warehousing • Floodlit areas • Offices • Sporting facilities • Public Buildings (Schools and Hospitals) • Motorways • Retail Outlets • Car Parks 8
Award Winning Design 9
Recommend
More recommend