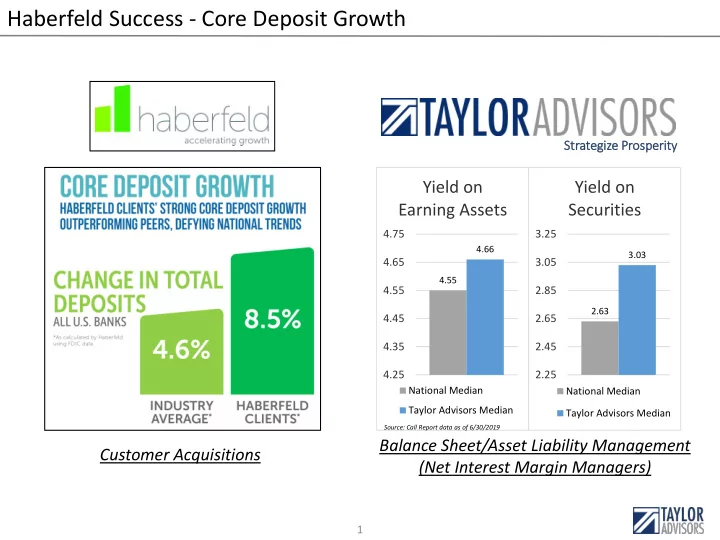

Haberfeld Success - Core Deposit Growth St Strategiz ize Prosp sperity Yield on Yield on Earning Assets Securities 4.75 3.25 4.66 3.03 4.65 3.05 4.55 4.55 2.85 2.63 4.45 2.65 4.35 2.45 4.25 2.25 National Median National Median Taylor Advisors Median Taylor Advisors Median Source: Call Report data as of 6/30/2019 Balance Sheet/Asset Liability Management Customer Acquisitions (Net Interest Margin Managers) 1
Balance Sheet Strategies for New Deposit Customers Haberfeld’s customer growth strategy > achieves success Are you Monetizing Haberfeld’s new deposit growth? Three Balance Sheet > implications for core deposit growth 2 2
Balance Sheet Strategies and Challenges for New Deposit Customers • Wholesale Funding (FHLB Advances and Brokered CDs) Replace High • Local Rate Shoppers Cost Funding • Organic Deposit Growth • Lowering Cost of Funds Funding New • Earning Asset Growth (Grow Loan Footings) • Increasing Net Interest Income Loan Demand • Loan Growth Exceeding Deposit Growth Balance Sheet • Average or Below Peer Earning Asset Yield (mix, pricing, etc.) Opportunities • Managing Excess Liquidity to Improve Performance Management • High Cash Balances can be an Investment Opportunity Taylor Advis isors can help lp im improve earning asset yie ield lds, investment yie in ield lds, and/or reduce excess liq liquid idity 3
Performance Metrics Among All U.S. Banks NII Dependency Net Interest Margin 1.00 5.00 0.95 4.70 4.75 0.95 4.50 0.90 0.87 4.25 0.85 4.00 3.80 0.80 3.75 3.50 0.75 0.72 3.25 0.70 3.00 2.91 0.65 2.75 0.60 2.50 10th Percentile Median 10th Percentile Median 90th Percentile 90th Percentile Source: S&P Global Market Intelligence, Data as of 6/30/19 The more net interest income dependent your institution is, the more NIM will drive earnings Net Interest Income Dependency is defined as: Net Interest Income/(Net Interest Income + Non-Interest Income) 4
Suboptimal Balance Sheet Management Example Performance and Balance Sheet Snapshot - 2019Q1 Strategize Prosperity 700 N. Hurstbourne Parkway Louisville, KY 40222 Performance Rankings www.tayloradvisor.com Sample Bank versus UBPR Peer Group* Performance Rankings 5.00 UBPR Peer Group Percentile Metric Sample Bank Average** Rank 4.50 Yield on Investments (FTE) 2.04 2.73 6% Net Yield on Total Loans 5.06 5.34 30% Interest 4.00 Earning Asset Yield (FTE) 4.00 4.67 11% Margin Interest Expense to Avg. Earning Assets 0.40 0.83 12% Dissection Net Interest Margin (FTE) 3.61 3.83 33% 3.50 Return on Average Assets 0.63 1.11 11% Net Interest Income Dependency Ratio 0.77 0.85 14% 3.00 Sample Bank versus State Banks 2.50 State Bank Percentile Metric Sample Bank Average Rank Yield on Investments (FTE) 2.04 2.62 11% 2.00 Net Yield on Total Loans 5.06 5.20 47% Interest Earning Asset Yield (FTE) 4.00 4.54 10% 1.50 Margin Interest Expense to Avg. Earning Assets 0.40 0.79 21% Dissection Net Interest Margin (FTE) 3.61 3.72 40% 1.00 Return on Average Assets 0.63 0.89 31% Yield on Investments (FTE) Earning Asset Yield (FTE) Net Interest Margin (FTE) Net Interest Income Dependency Ratio 0.77 0.87 14% Sample Bank UBPR Peer Group Avg. Sample State Average Earning Asset Mix and Balance Sheet Positions Earning Asset Mix Liquidity and Funding Asset Size ($000) 652,743 Pledged Securities (% of Portfolio) 70% Net Loans ($000) 369,296 57% Liquidity Ratio 29% Security Portfolio ($000) 101,414 16% FHLB Advances and Brokered CDs ($000) 0 Cash and FFS ($000) 143,396 22% Cost of Funds (% of Average Liabilities) 0.41% Investment Portfolio Capital Municipals (% of Portfolio) 20,074 20% Tier 1 Capital 55,506 MBS (% of Portfolio) 11,891 12% Tier-1 Leverage Ratio (%) 8.64 CMO (% of Portfolio) 10,209 10% Total Risk Based Capital 57,739 Agencies (% of Portfolio) 46,231 46% Total Risk-Based Capital Ratio (%) 13.65 Other Securities (% of Portfolio) 13,009 13% Municipals (% of Total RBC) 35% 5
ALCO Best Practices Economy and Rates Strategies 6
Todd Taylor, CFA, CPA President & Managing Director Phone: +1 (502) 412-2524 Email: todd@tayloradvisor.com www.tayloradvisor.com 7
Recommend
More recommend