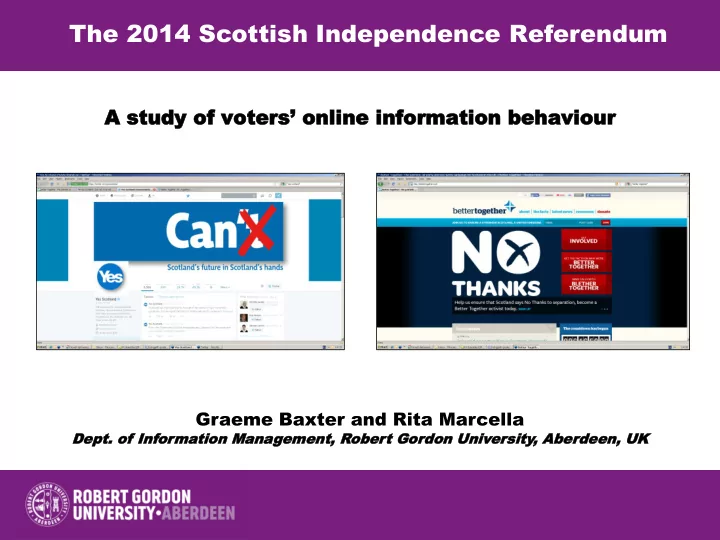

The 2014 Scottish Independence Referendum A study of voters’ online information behaviour Graeme Baxter and Rita Marcella Dept. Dept. of of Inf nfor orma mation tion Mana anagement, R gement, Rober obert G t Gor ordon U don Univ niver ersity ity, , Aber Aberdeen, deen, UK
Thursday, 18 th September 2014 The Referendum on Independence for Scotland Images: Electoral Commission
Aims of User Study Identify motivations for, and barriers to, public use of campaign sites Investigate the types of information, tools and technologies voters most value Assess the likelihood of campaign sites being visited again Explore the extent to which they influence voting behaviour
User Study Used the ‘interactive, electronically - assisted interview’ method So far, interviews conducted in:- - Robert Gordon University library - Aberdeen’s busiest community centre - a church serving Commonwealth citizens Plans to conduct further interviews in:- - a care home for older people - a sports centre Used laptop with mobile broadband ‘dongle’; iPad; and smartphone
Profile of Sample (to date) 54 interviews conducted so far 22 male, 32 female; from a range of age groups 29 in employment, 4 seeking work, 21 students 48 eligible to vote in referendum, 46 will definitely be voting Majority were regular and confident computer and Internet users Just 3 had never used social media
Need for Concise Policy Documents Reluctance to look at the Scottish Government’s White Paper (670 pp) or other lengthy and wordy policy documents Preference for concise documents and statements (e.g. Better Together’s 2 - to 3-page factsheets)
Positive About the Use of Infographics
Need For ‘Facts’ Rather Than Opinion -Based Information Unconvinced by over- reliance on opinions of ‘ordinary people’ Instead expressed a need for ‘facts’ about the impact of independence or of remaining in the UK
Sceptical About Impartiality and Reliability of Information Presented General acknowledgement of likely bias in information presented Need expressed for more information on sources sources of data/statistics presented
Further Levels of Cynicism Cynical about some of the imagery used Cynical about the use of celebrity endorsements
Post-Search Evaluative Questions 91% thought campaign sites are a useful way of providing information 91% found them easy to use 89% found the content interesting 93% found the content easy to understand 65% might look at campaign sites again before 18 th September
But… Just 37% described the information as ‘very’ or ‘quite’ reliable For 75% the campaign sites had no influence on their voting intentions Instead, a continued preference for ‘traditional’ information sources and campaign methods
Recommend
More recommend