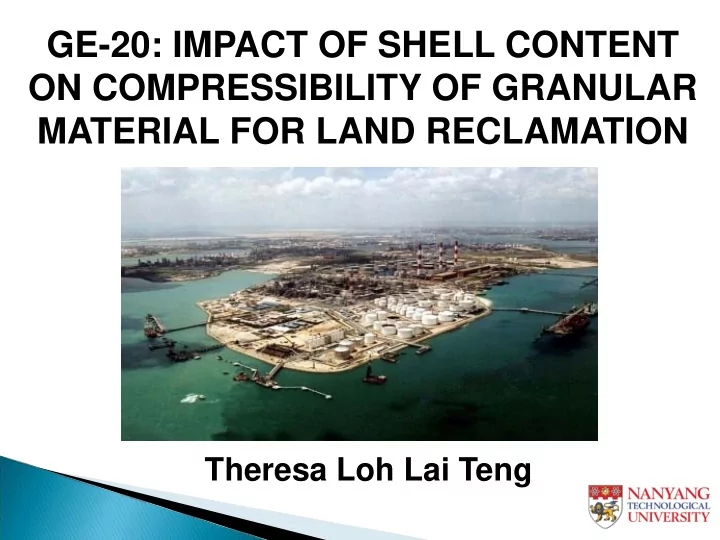

GE-20: IMPACT OF SHELL CONTENT ON COMPRESSIBILITY OF GRANULAR MATERIAL FOR LAND RECLAMATION Theresa Loh Lai Teng
Scope of presentation • Objectives • Carbonate Test • Soil Properties and Test Procedures • Oedometer Tests • Constant Rate of Strain (CRS) Tests • Conclusions and Recommendations
Carbonate Test (BS1377-3:1990 & BS6463-2:1984) Source 1 Source 1 Source 2 ource 2 Source 3 ource 3 Shell hell 0% 6% 0% 39% 1% 7% 1% 43% 0.3 – 1.7% 8.5 – 25.1% 0.2 – 1.2% -
Basic Soil Properties Soi Soil Properti Properties es Source Source 1 1 Source ource 2 2 Source ource 3 3 Specific Gravity Specific Gravity 2.64 - 2.68 2.69 - 2.71 2.65 - 2.69 ρ d, d, max 1.79 1.74 1.71 max ρ d, d, min 1.51 1.45 1.35 min e max 0.75 0.85 0.96 max e min 0.48 0.55 0.55 min Coefficient of Coefficient of 1.5 3.8 3.4 Uniformity Uniformity Coefficient of Coefficient of 0.9 2.3 1.0 Curvat Curvature USCS USCS SP SP SP
Sieve Analysis (British Standard)
Preparation Method for Oedometer Oedometer size: 63 x 19.2mm Sand from all 3 Sources - Sand sieved through 2mm sieve Shell from Source 2 - Shell greater than 1.18mm are separated manually
Soil Density and Void Ratio in Oedometer Void Ratio Source 1 Source 2 Source 3 Relative Density Loose 0.65 – 0.66 0.75 – 0.78 0.82 – 0.85 (28-35%) Medium 0.62 – 0.64 0.71 – 0.74 0.76 – 0.79 (42 – 45%) Dense 0.55 – 0.56 0.63 – 0.66 0.66 - 0.68 (68 – 72%)
Oedometer Result (S1-M-20)
Original Behaviour of Sand (0%)
Effect of Shell Content (Source 1)
Repeated Dense Sand
Compression Index, C с (Source 1)
Compression Index, C с (Source 2)
Compression Index, C с (Source 3)
Convert Shell Content to Carbonate Content Dean, 1974: LOI at 1000ºC / 0.44 = % of CaCO3 Average carbonate content of 100% shell from Source 2 is: BS1377 BS6463 0.5 * (89.5% + 97.9%) = 93.7% For 30% Shell Content, Carbonate Content is: 30% * 93.7% = 28.1%
C с and C r from Literature Review Carbonate Initial Soil Type Location Cc Cr Reference content (%) Void Artificial carbonate sand 97 0.275 0.012 0.9 Grine,2007 Silicate sand Samyang 5 0.055 - 0.925 Kim et al., 2008 5 0.075 - 0.925 Silicate sand Samyang Kim et al., 2008 Gymnyeong 89 0.14 - 1.3 Carbonate sand Kim et al., 2008 Gymnyeong 89 0.205 - 1.3 Carbonate sand Kim et al., 2008 Silicate & carbonate sand Jeju harbor 54 0.2 - 1.46 Kim et al., 2008 Silicate & carbonate sand Jeju harbor 54 0.225 - 1.46 Kim et al., 2008 West of Republic of 88 0.335 0.0075 - Dogs Bay Sand Coop MR,1990 Ireland Carbonate Content: 5 to 97%
C с from Literature Review Dr= Dr= Dr= Dr= Dr= Dr= Soil Type 0% 20% 40% 60% 80% 100% Medium to coarse sand, some fine - - 0.005 - - - gravel (SW) 0.010 0.008 0.006 0.005 0.003 0.002 Medium to coarse sand (SW/SP) 0.011 0.009 0.007 0.005 0.003 0.002 Fine to coarse sand (SW) 0.013 0.010 0.008 0.006 0.004 0.003 Fine to medium sand (SW/SP) 0.015 0.013 0.010 0.008 0.005 0.003 Fine sand (SP) Fine sand with trace fine to - - 0.011 - - - coarse silt (SP - SM) Fine sand with little fine to coarse 0.017 0.014 0.012 0.009 0.006 0.003 silt (SM) Fine sand with some fine to - - 0.014 - - - coarse silt (SM) Modified from Coduto, 2001
C с from Literature Review For 93.7% carbonate content
Sand with shells C с from Literature Review Fine Sand
Settlement (Source 1)
Constant Rate of Strain (CRS) Test • Loading rate: 0.005 mm/min • Unloading rate: 0.003 mm/min
CRS vs Oedometer S3-D-0 CRS
Conclusion • Carbonate content tests by BS1377 and BS6463 are comparable. • Effect of relative density on C c is less than effect of shell content on C c . • C r is less affected by shell content • The effect of shell content on C c is small when shell content is less than 20%. • CRS tests and oedometer tests are comparable.
Recommendation • Influence of inclusion of particles bigger than 2mm • Effect of the strength of the shells • Effect of rate of loading for CRS tests
Recommend
More recommend