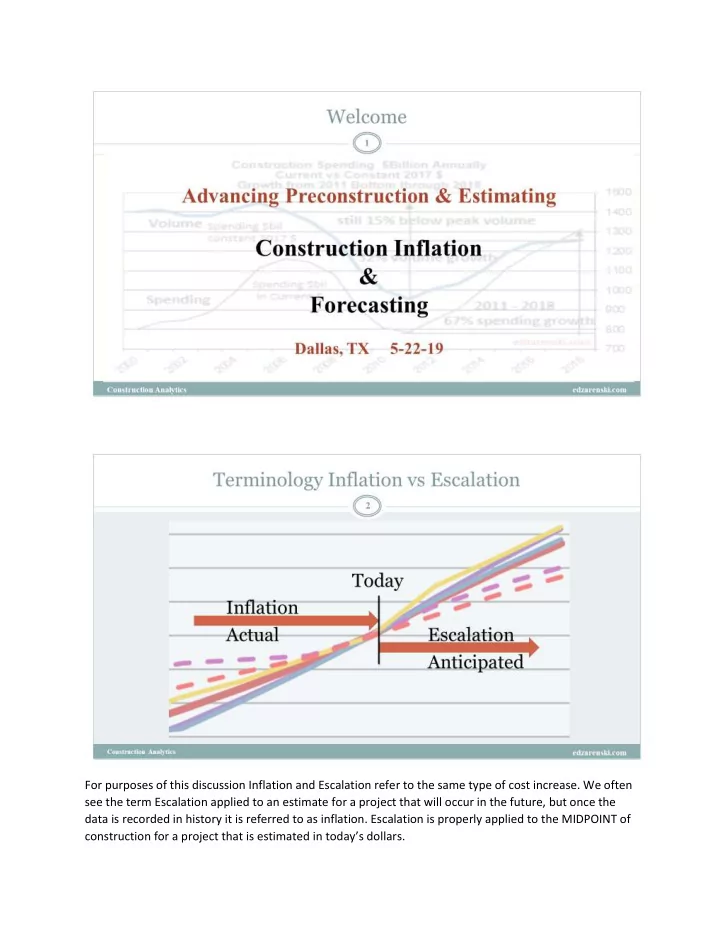
For purposes of this discussion Inflation and Escalation refer to the same type of cost increase. We often see the term Escalation applied to an estimate for a project that will occur in the future, but once the data is recorded in history it is referred to as inflation. Escalation is properly applied to the MIDPOINT of construction for a project that is estimated in today’s dollars.
The level of construction activity in a metropolitan area has a significant impact on labor availability and bid activity. Margins tend to increase when work is plentiful and decrease when work is scarce.
When assessing the impact of material cost increases on the project, be aware of which materials have greater impact on the cost of a whole building. Apply changes on the appropriate level of cost. A 25% steel tariff does not get applied on the cost of the steel contract.
Trade subcontractors may use Input indices to develop bid pricing, but an owner or CM/GC would need an Output index to adjust the cost of a building over time. Output indices represent total project cost. No Input cost index accounts for changes in margins. Some don’t account for changes in labor. Input indices should not be used to forecast inflated final cost of a building.
PPI contractors and buildings indices attempt to account for all final cost. All other PPI indices are input costs at various levels of input. Some of them represent pre-wholesale cost changes. This compares nonresidential final cost indices to an input index. Since 2011, if you inflated cost using ENR-BCI (red line) you would have undercut real cost by 12% compared to final cost index (black line).
These Output cost or Final cost indices can be used to move whole project costs over time. Nonresidential Buildings, Non-building Infrastructure and Residential Indices vary greatly from each other. Use an index that applies to building type. Notice in this plot Input indices ENR and RSMeans for 2010 to 2017 increased only from 85 to 100, 17% growth. Final cost indices increased from 77 to 100, 30% growth. Not shown on this plot but neither
RSMeans nor ENRBCI, both input indices, showed a decline during the great recession. All other indices showed a steep decline from 2008-2010. This table normalizes all indices to the same baseline 2017 = 100. That allows indices to be compared. This is a small subset of the index data published in Construction Inflation Tables on edzarenski.com Construction Analytics website.
The plots here show Construction Analytics indices (the highlighted data in the table above). If a farm stand sold a crate of apples for $25 four years ago and the same size crate of apples sells for $100 today, the farm stand revenues increased but the amount of business volume did not increase. All the increase in revenue was inflation.
Dodge Momentum Index, Architectural Billings Index and Dodge Construction Starts are all leading indicators of future construction spending activity. For nonresidential work we have 70% to 80% of expected spending this year already in backlog as the year began. For new starts within the year, approximately 20% of the spending occurs in the year started, 50% in the next year, 25% in the third year. This means nonresidential spending growth in 2019 is still being affected by starts from 2016.
Amount of “actual” data in forecast drops off dramatically between 12-24 months. Starts is not Spending. Starts must be adjusted for share of total market, then cash flowed over time to get spending. Need to look at a minimum of 3to 4 years of starts to predict spending in the next year. Starts referenced here is Dodge Data New Construction Starts.
Large increases in starts could be a change in share of market captured. Starts share of market must be considered before using starts to forecast future spending.
2019 spending growth forecast at +0.5%, but Inflation is predicted to average 4%. Real Volume in 2019 declines by 3.5%. Major growth in Highway, Public Works Amusement/Recreation. Business planning choices made on data unadjusted could lead to improper business decisions.
Inflation averaged 4% for last 6 years. Volume is not growing as fast as spending (or Revenue) would indicate. Spending up 67% from 2011 low point to end 2018. But inflation average 4% for last 6 years. Real volume growth since bottom is only 32%. Real Volume is still 15% below previous peak high in 2005. Volume is not growing as fast as spending (or Revenue) would indicate.
Prior to recession, in 2003-2007, spending was increasing 10%+/year. Jobs increased +15% in 3 years. But inflation was 8%+/year. Real volume increased only 2% in 3 years. High rate of inflation in the spending led to excess jobs growth. Construction added 1.6 million jobs in 6yrs 2013-2018, the fastest rate of jobs growth since 1995-2000. 29% growth in jobs but only 25% growth in real volume after inflation.
Recommend
More recommend
Unleash a World of Digital Possibilities—Browse, Share, and Explore Content Without Boundaries


![Primordial black holes from Higgs inflation? Eemeli Tomberg 27.5.2019 [1810.12608] In](https://c.sambuz.com/344355/primordial-black-holes-from-higgs-inflation-s.webp)