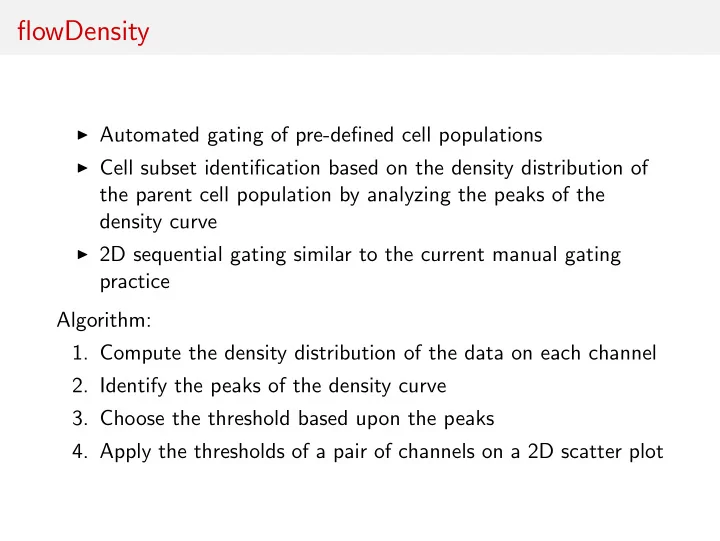

flowDensity ◮ Automated gating of pre-defined cell populations ◮ Cell subset identification based on the density distribution of the parent cell population by analyzing the peaks of the density curve ◮ 2D sequential gating similar to the current manual gating practice Algorithm: 1. Compute the density distribution of the data on each channel 2. Identify the peaks of the density curve 3. Choose the threshold based upon the peaks 4. Apply the thresholds of a pair of channels on a 2D scatter plot
Threshold Selection a. If there are exactly two peaks, the threshold is the minimum HIP-C PBMC data, T cell panel, Blomberg intersection between these two peaks
Threshold Selection HIP-C PBMC dataset, T cell panel, Stanford b. If there are three or more peaks, a score is calculated based on the height and distance of the peaks for each pair of adjacent peaks. The score then determines the place of the threshold by picking a pair of peaks.
Threshold Selection c. If there is only one peak, the threshold is determined by one of the following approaches:
Threshold Selection, contd. HIP-C PBMC dataset, T cell, Stanford c.1. Identifying of inflection or flex points
Threshold Selection, contd. HIP-C PBMC dataset, T cell, Stanford c.1. Identifying of inflection or flex points c.2. Tracking the slope (derivative) of the curve
Threshold Selection, contd. HIP-C PBMC dataset, B cell, Blomberg c.1. Identifying of inflection or flex points c.2. Tracking the slope (derivative) of the curve c.3. Setting a percentile threshold
Threshold Selection, contd. HIP-C PBMC dataset, B cell, Blomberg c.1. Identifying of inflection or flex points c.2. Tracking the slope (derivative) of the curve c.3. Setting a percentile threshold c.4. peak + / − a multiplier of standard deviation
Threshold Selection, contd. Parameters of each of the four approaches for the single-peak distribution: ◮ can be set optionally by user ◮ otherwise is set by flowDensity based upon the the statistics of the density distribution
Results: HIP-C Lyoplate Panel 20 seconds to run all samples (up to 5,000)
Mouse Knockout Results
Mouse Knockout Results
Acknowledgements BCCA ◮ Jafar Taghiyar, Radina Droumeva, Mehrnoush Malekesmaeili Funding ◮ NIH (NIBIB) & HIP-C Supplement (PI: Raphael Gottardo)
Recommend
More recommend