Florida Water and Climate Alliance Session 4 2016 Winter Workshop - PowerPoint PPT Presentation
Florida Water and Climate Alliance Session 4 2016 Winter Workshop Peace River Decision Tool Experience at the 2:30 3:30 PM Peace River Facility Arcadia, Florida November 16, 2016 The Peace River Manasota Regional Water Supply Authority
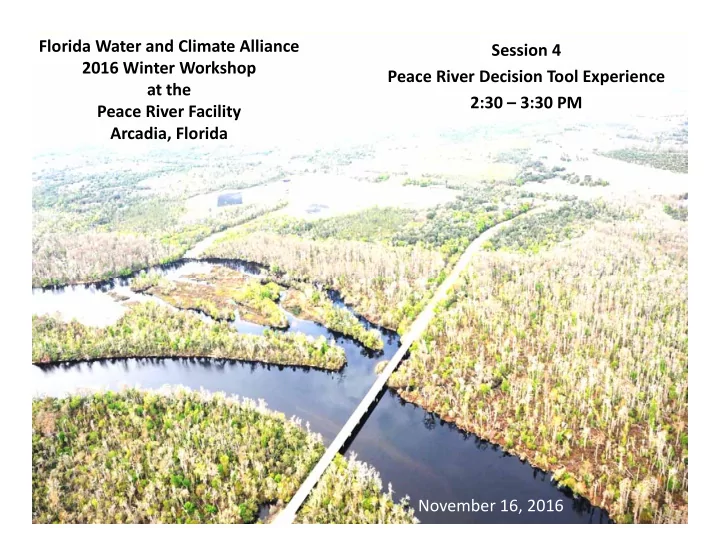
Florida Water and Climate Alliance Session 4 2016 Winter Workshop Peace River Decision Tool Experience at the 2:30 – 3:30 PM Peace River Facility Arcadia, Florida November 16, 2016
The Peace River Manasota Regional Water Supply Authority • Created in 1982 • 4 Member Counties • Serves a population of about 500,000
Drainage Basin & the Peace River Facility • Location of Peace River Facility
The Peace River Facility
The Peace River is our Source Water
120 MGD River Intake Pump Station
How Much is 120 MGD? Enough to Fill Raymond James Stadium to the Upper Deck Every Day
6.5 BG in Off-Stream Storage Reservoir 1 Reservoir 2
51 MGD Treatment Capacity
6 BG in Underground Storage 21 Finished Water ASR Wells
During Months without ASR Recovery
During Months with ASR Recovery
The Upper Peace River can go Completely Dry Picture from FDEP’s “Florida’s Water” webpage Picture by Sam Stone during 2000-1 drought
The Peace River near Arcadia - typical dry and wet season views
• River flows vary dramatically (8 Mgd – 18 Bgd)
Although more than 25 miles from the Gulf of Mexico, our river intake is tidally influenced
How Much is 3 millimeters a Year? • Take 2 pennies and stack them on top of each other = 3 mm • This is 1.2 inches in 10 years • This is 1 foot in 100 years • Some Suggest that due to the Anthropogenic Linkage, this Rate is Accelerating
The Peace River Facility
2010-2013 USGS top/bottom continuous (15-minute) recorder data at the Facility’s intake
Data Used in Statistical Model Development Model domain = hourly averaged data when upstream flow was >80 and < 500 cfs & 30-day preceding flow < 500 cfs
Limited number of parameters to non- autocorrelated accounting for 1% variation • Model R 2 = 0.61
2025 2050 2075 Probability (%) cm inches cm inches cm inches 90% (best case) 7 2.8 13 5.0 20 7.7 50% (median 13 5.1 24 9.4 37 14.4 expected) 5% (worst case) 22 8.7 41 16.1 63 24.6 Projected potential probabilities of future increases in near future sea-level rise along southwest Florida coast (IPCC) ) • Future sea-level changes applied in the statistically based modeling used USEPA estimates estimating the probability of occurrence • Provided potential range of sea-level change at three future 25-year intervals
6 Scenarios Selected Scenario Sea Level Rise (inches) baseline 0 1 2.8 2 5.0 3 7.7 4 14.4 5 24.6
Scenario 1 Scenario 2 Scenario 3 Scenario 4 Scenario 5 baseline 700 us/cm Predicted statistical distribution of conductivity at the Facility intake under each future sea-level rise alternative (using available 2010-2013 flow and stage data)
Formulating Future SLR Scenario Curves for River/TDS Relationship • Use SAS model to project median TDS for scenario at 300 cfs river flow • Mimic proportional TDS expansion and compression ratios taken from baseline data for 100 and 500 CFS limits, respectively • Set high flow convergence to good quality water, i.e. 15,000 cfs = 100 mg/L TDS • Fit polynomial expression to the datum
System Reliability Modeling Starts by Defining Fundamental Solvent & Solute Mass Balance Relationships (Solute in this case is TDS)
• Solving for Day Ending reservoir and ASR volumes is straightforward • Solving for Day-Ending TDS concentrations is more rigorous (examples below)
System Reliability Model • PRO-PAT Model (Peace River Operability Platform Assessment Tool) • Excel-based decision tool • 6 embedded SLR scenarios • Model has 109 Variables – 49 operational variables – 60 climate associated variables • Can apply a monthly multiplier for rainfall • Can change monthly multiplier for evaporation • Can apply a monthly flow multiplier for 3 streams
Reliability Measures • Quantity Reliability (# days met full demands) (total days) • Quality Reliability (# days met full demands with TDS < 500 mg/L) (total days)
Summary • Decisions Made Today Must be Considered in View of What is Likely in 50 – 100 years • Strategic Planning Must Consider Adaptation Management Strategies • Guidelines can only speak to process generalities – Utilities must employ creativity in customizing Adaptive Management Decision Tools and Strategies for their own reality • Don’t be afraid to borrow approaches from others, we are all in this together! • Likewise, share approaches you have developed with others!
Acknowledgements • Ralph Montgomery - Atkins • Mike Coates, PG – PRMRWSA • Mike Heyl/SWFWMD • Others • Sam Stone – PRMRWSA • Mark McNeal, PG - ASRUS Inc. • Pete Larkin, PG - CH2M HILL • Ryan Messer, PE – CH2M HILL • Florida Water and Climate Alliance
Recommend


More recommend
Explore More Topics
Stay informed with curated content and fresh updates.