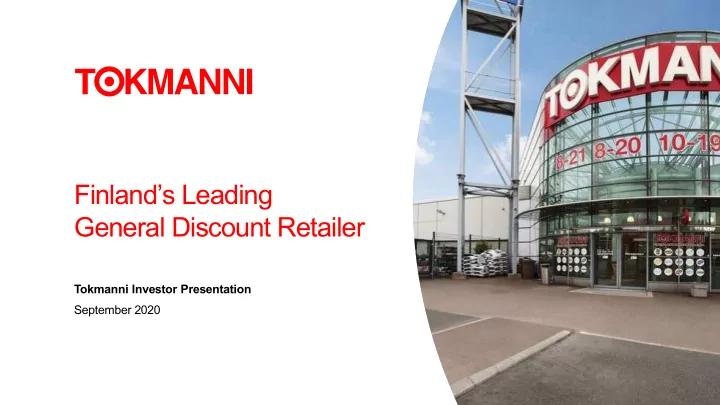

Finland’s Leading General Discount Retailer Tokmanni Investor Presentation September 2020
Tokmanni is no. 1 general discount retailer in Finland > 1 million Length 1 157 km or 719 miles 190 customer visits stores in Finland per week 944 MEUR 3,900 revenue 2019 employees Width 542 km or 337 miles 2 4.9.2020 Tokmanni IR Presentation 2020
Current financial status 1-6/2020 Comparable LFL revenue Revenue gross margin +11.8% +13.3% LFL customer visits +2.2% 33.5% (33.4%) Cash flow from Comparable EPS operating activities EBIT margin EUR 0.34 (0.14) 6.4% (3.9%) MEUR 55.3 (9.5) 3 4.9.2020 Tokmanni IR Presentation 2020
Tokmanni’s and non-grocery market development in Finland, % Sales development, % 20,0 19,2 16,0 12,0 10,2 11,0 9,9 8,0 10,9 5,8 7,8 8,3 8,0 7,6 6,1 4,0 4,5 4,4 3,6 4,0 0,0 1,9 1,6 1,4 0,6 1,1 -0,1 -1,1 -1,9 -4,0 -2,9 -8,0 -7,4 -7,0 -9,0 -12,0 -11,0 Q1/17 Q2/17 Q3/17 Q4/17 Q1/18 Q2/18 Q3/18 Q4/18 Q1/19 Q2/19 Q3/19 Q4/19 Q1/20 Q2/20 Tokmanni Non-grocery market The figures include the following member companies of FGTA: department store and hypermarket chains K-Citymarket, Prisma, Sokos, Tokmanni and Minimani. Source: The Finnish Grocery Trade Association. 4 4.9.2020 Tokmanni IR Presentation 2020
Tokmanni’s competitive advantages • Low prices • Interesting and wide product selection • Service-minded and motivated employees • Nationwide store network combined with online store • Efficient and agile business model 5 4.9.2020 Tokmanni IR Presentation 2020
Tokmanni’s sources of competitive advantages • Emphasis on customers, awareness of prices and costs • Professional purchasing • Best place to work in retail • Easy and quick to reach • Cost-efficient supply chain and support functions 6 4.9.2020 Tokmanni IR Presentation 2020
Tokmanni’s customer base, family households being slightly overemphasized Whole population Tokmanni’s customers 43% 40% 17% 17% 16% 16% 13% 12% 7% 7% 6% 5% Family households Adult households Pensioners Adult singles Young singles Young couples Note: Tokmanni’s customers = Customers that frequently visit Tokmanni Sources: TNS Mind 2018 7 4.9.2020 Tokmanni IR Presentation 2020
We are building destination categories We will significantly increase the sales of Home decoration private labels and kitchen Health, Home beauty improve- and well- ment being No. 1 in customer minds, customer reach or sales Cleaning and Clothing storage Garden 8 4.9.2020 Tokmanni IR Presentation 2020
Tokmanni’s strategic actions € Sources of growth Sources of profitability Sources of success • Destination categories • Private labels • Employees • Online store • Sourcing • Customers • Store network • Supply chain and • Sustainability inventories 9 4.9.2020 Tokmanni IR Presentation 2020
Tokmanni’s online business • Price level competitive with Amazon • Reliable service and support for Finnish customers • Nationwide store network in Finland • Wider assortment in online under construction 10 4.9.2020 Tokmanni IR Presentation 2020
Financials
Tokmanni’s revenue development – last 10 years 944 870 797 776 755 732 711 690 654 634 2010 2011 2012 2013 2014 2015 2016 2017 2018 2019 12 4.9.2020 Tokmanni IR Presentation 2020
1-6/2020: Comparable EBIT development Comparable Revenue, EBIT, M€ M€ 484,9 500,0 35,0 428,0 450,0 391,3 30,9 30,0 400,0 25,0 350,0 300,0 20,0 250,0 16,5 15,0 200,0 11,1 150,0 10,0 100,0 5,0 50,0 0,0 0,0 1-6/2018 1-6/2019 1-6/2020 Revenue Comparable EBIT 13 4.9.2020 Tokmanni IR Presentation 2020
Target of comparable EBIT margin is about 9% 9,0 % Key actions taken 0,5-1,5 % 7,5 % 0,5 -1,0 % Increasing gross margin 0,5 % • Direct import and private labels 1,0 % 6,0 % • Batch sales • Shrinkage and inventory management Improving efficiency • Cost control • Supply chain • Real estate rentals and maintenance EBIT-% 2018 Operating Gross margin EBIT-% 2019 Operating Gross margin EBIT-% target expenses improvement expenses improvement improvement improvement potential potential 14 4.9.2020 Tokmanni IR Presentation 2020
Solid dividend track-record • Dividend policy: Tokmanni’s aim is to distribute around 70% of net income for each financial year in dividends, depending on the capital structure, financial position, general economic and business conditions and future prospects. 0,62 0,51 0,50 0,41 2016 2017 2018 2019 Dividend, EUR 15 4.9.2020 Tokmanni IR Presentation 2020
Tokmanni’s long-term financial targets Stable and profitable long-term growth Like-for-Like revenue growth Low single digit growth Target of over 200 stores Stores New about 5 p.a. 12 000 sqm annually Gradually increase to ~9% Comparable EBIT margin Net Debt / Comparable EBITDA In long-term below 3.2x 16 4.9.2020 Tokmanni IR Presentation 2020
Thank you! ir@tokmanni.fi tokmanni.fi tokmanni.fi
Recommend
More recommend