Financial Results (Data through September 2014) 1 Financial - PowerPoint PPT Presentation
Financial Results (Data through September 2014) 1 Financial Results Jan Sep Jan Dec Amount ($000s) 2014 2014* Enrollment 16,000 16,000 Revenue $119,994 $159,389 Claims $137,315 $185,346 Administration $ 6,420 $
Financial Results (Data through September 2014) 1
Financial Results Jan – Sep Jan – Dec Amount ($000’s) 2014 2014* Enrollment 16,000 16,000 Revenue $119,994 $159,389 Claims $137,315 $185,346 Administration $ 6,420 $ 8,426 Total Expenses $143,734 $193,772 Contribution to Reserves ($ 23,741) ($ 34,383) Assets as % of ACL 220% 151% * Low Trend Scenario 2 Actuar uaries es N Nor orthw hwes est
Financial Drivers (Medical) Driver Impact 2014 Planned Loss (at Ratesetting) ($4.8 M) Longer CIGNA Claim Lag ($9.6 M) Provider Discounts & Coordination of Benefits $0.9 M Hospital Charge Increases ($7.4 M) Mental Health Capitation Program ($1.5 M) FSA Contribution Effect ($1.6 M) Open Enrollment ($1.1 M) Large Claims ($4.3 M)* Infusion Drugs ($0.3 M)* Expanded Access due to Health Centers ($4.5 M)* Increase in Health Screenings TBD Total ($34.2 M) * Estimated or In Progress 3 Actuar uaries es N Nor orthw hwes est
CIGNA Claim Lag: ($9.6M) Average claim lag increased from 1.35 months in 2012 to 2.42 months in 2013. 2014 year-to-date average is 2.13 months. 4 Actuar uaries es N Nor orthw hwes est
Provider Discounts & COB: $0.9M Distribution of Billed Charges For every $1.00 of billed charges, the reduction due to provider discounts and COB increased from $0.41 in 2012 to $0.44 in 2013 & 2014 YTD. 5 Actuar uaries es N Nor orthw hwes est
Hospital Charge Increase: ($7.4M) From January 2012 through September 2014, the average Board & Room cost per day increased by 39.8%, or 13.4% annually. 6 Actuar uaries es N Nor orthw hwes est
Mental Health Capitation: ($1.5M) Average cost for mental health increased from $3.8 million in 2012 to $5.8 million in 2013. Projected near $6 million for 2014. 7 Actuar uaries es N Nor orthw hwes est
FSA Contribution Effect: ($1.6M) For each $1 additional FSA contribution, members incur an additional $0.71 in cost-sharing; this corresponds to an additional $3.66 in plan cost. 8 Actuar uaries es N Nor orthw hwes est
Open Enrollment: ($1.1M) Categories affected by open enrollment (Spouse – New, Child – New (Other)) have cost trends similar to other categories. 9 Actuar uaries es N Nor orthw hwes est
Large Claims: ($4.3M) The number of large claimants and total incurred claims both exceed initial 2014 projections. 10 Actuar uaries es N Nor orthw hwes est
Large Claims Of the top large claimant diagnoses, the highest growth areas are cancer and circulatory system disorders. 11 Actuar uaries es N Nor orthw hwes est
Other Drivers Infusion Drugs Expanded Access due to Health Centers Increase in Health Screenings 12 Actuar uaries es N Nor orthw hwes est
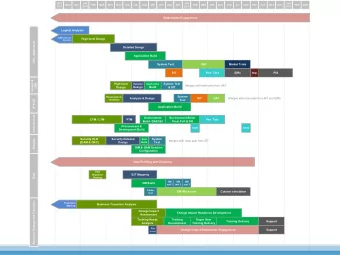
Funding vs. Expenses State of Montana Projected Health Care Funding vs. Expenses $300,000,000 $250,000,000 $200,000,000 $150,000,000 $100,000,000 $50,000,000 $- PY 2012 PY 2013 PY 2014 PY 2015 PY 2016 PY 2017 Actual Expense Proj. Expense (Low Trend) Proj. Expense (High Trend) Funding Increase of 10% in 2014, 10% in 2015 Low Trend 94.7% Loss 99.9% Loss 121.6% Loss 109.3% Loss 118.4% Loss 128.6% Loss High Trend 122.1% Loss 112.7% Loss 125.4% Loss 139.8% Loss 13 Actuar uaries es N Nor orthw hwes est
Recommend


More recommend
Explore More Topics
Stay informed with curated content and fresh updates.