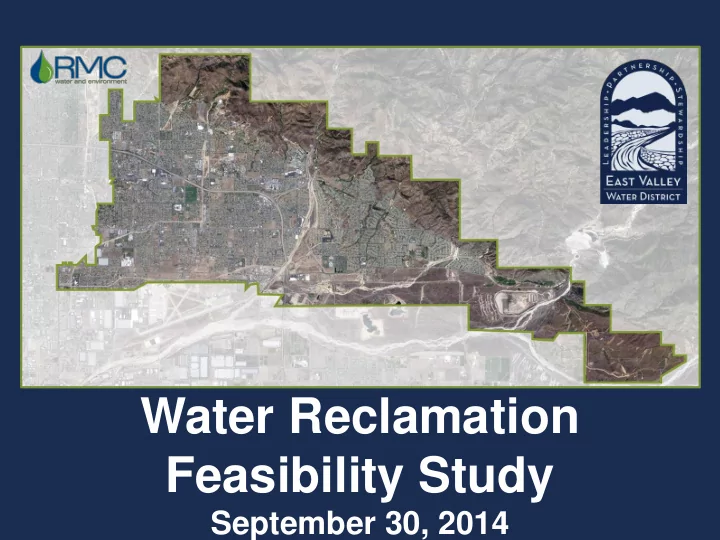

Water Reclamation Feasibility Study September 30, 2014
Building a Strong Team John Mura, General Manager/CEO Mike Maestas, Assistant General Manager Tom Holliman, Engineering Manager Kelly Malloy, Public Affairs/Conservation Manager Ashok Dhingra, AKD Consulting Principal Lyndel Melton, RMC, Principal in Charge Steve Hirai, RMC, Project Manager
Current Capacity vs. Long-term Needs Current System Capacity Current Usage: 26,530 Units Remaining: 220 Units Approximately 6,000 units have been included in approved Land Use Agency Master Plan documents.
Challenges We Face Today Master Plan Results Rate Droughts Structure EVWD Future Local Control Development
Taking it to the Board May June July August September October Site Selection Required Infrastructure Potential Uses Treatment Requirements Potential Partnerships Complimentary/Secondary Uses Costs and Financing Draft Report/Summary Final Report Continuous Outreach
Three Potential Plant Locations Near Golden Near District Triangle Headquarters Sterling Avenue 210
Taking a Closer Look at the Sterling Avenue Site Near Near Golden Sterling Headquarters Triangle Area Between 3 rd and 5 th Available Flow Land Uses Impacts to Community Energy Impacts Site Availability Proximity to Reuse Sites Proximity to Recharge Sites Relative Lower Ranking Relative Higher Ranking
Where Would the Water Go? Urban Commercial/ Groundwater Irrigation Industrial Recharge Infrastructure Requirements Full Use of Available RW Ease of Implementation Cost to Implement Relative Lower Ranking Relative Higher Ranking
Boiling it Down to Three Choices Make System Improvements, All flow continues to San Bernardino 1. New Plant at Sterling, treat flows from East of Sterling only Remaining flow continues to San Bernardino 2. To Recharge New Plant at Sterling, treat all District flows 3. To Recharge
Comparing Option Costs 1. All Flow to 2. Partial 3. Treatment at San Treatment at Sterling for Bernardino Sterling Entire District 20-yr Cost to EVWD for $221 Million $136 Million - Treatment at San Bernardino 20-yr Cost for Treatment by - $120 Million $200 Million East Valley 20-yr Cost of New Treatment $61 Million $103 Million Facility 20-yr Cost of Infrastructure to $34 Million $29 Million $45 Million EVWD 20-yr Value of Water to East - ($89 Million) ($148 Million) Valley Percent Increase to Existing 40% 41% 10% Cost Costs represent total costs over 20 – years of operation
Impacts to New Development 1. All Flow to 2. Partial 3. Treatment at New Development Costs San Treatment at Sterling for Bernardino Sterling Entire District Capacity Cost for 4 MGD Treatment at San $30.1 Million Bernardino Treatment Impact of Future $34.4 Million $41.3 Million Demands Collection System Impact $34.6 Million $17.5 Million $8.9 Million of Future Demands Estimated Cost per EDU $7,525 $6,800 $5,840 -$725 -$1,685
More Than a Treatment Site
There are Opportunities for Multi-Use Development at Sterling
The Glass Half Empty Odor Noise Facility Design Property Values Surrounding Land Use
The Glass Half Full Creation of a new drought-proof water supply Avoided system improvements Increased local control
Creating an Information Loop Weekly Conference Calls Collaborate to prioritize messages Create digestible pieces
Creating an Information Loop 6 Public Workshops/Meetings 5 Monthly Print Advertisements Ran a total of 11 times 5 Monthly Bill Inserts +110,000 pieces 7 Newspaper Articles Website Content Neighborhood Meetings by Request Tours
24/7 Project Overview
Looking to Others That Are Good Neighbors District visited three facilities Anaheim Water Recycling Demonstration Facility Lighthouse Water Reclamation Facility Brightwater Reclamation Campus Selection Criteria Process must be completely enclosed Active steps taken to reduce/eliminate odors Must utilize 100% membrane treatment technology Incorporated design elements in building construction
Anaheim Water Recycling Demo Facility Tour Highlights Local example of odorless, noiseless facility Within 15 feet from Anaheim City Hall Designed in a way visitors can walk around the facility and learn
Lighthouse Reclamation Facility Tour Highlights Limited space for site No odors/noise Environmentally sensitive area Designed to fit seamlessly within harbor Lessons learned from their design/construction process
Brightwater Water Reclamation Campus Tour Highlights Extensive community engagement throughout similar feasibility evaluation process Incorporated multi-phase equipment expansions in design Zero odor threshold from community Passive/educational uses incorporated throughout site
Laying Out the Road Map 2014 2015 2016 2017 Feasibility Study Supplemental Studies Preliminary Design Environmental Docs. Regulatory Approval Financial Public Outreach Institutional Construction Initiate Operations
Contact Us Kelly Malloy, Public Affairs/Conservation Manager wwstudy@eastvalley.org | www.eastvalley.org/wwstudy (909) 885-4900
Recommend
More recommend