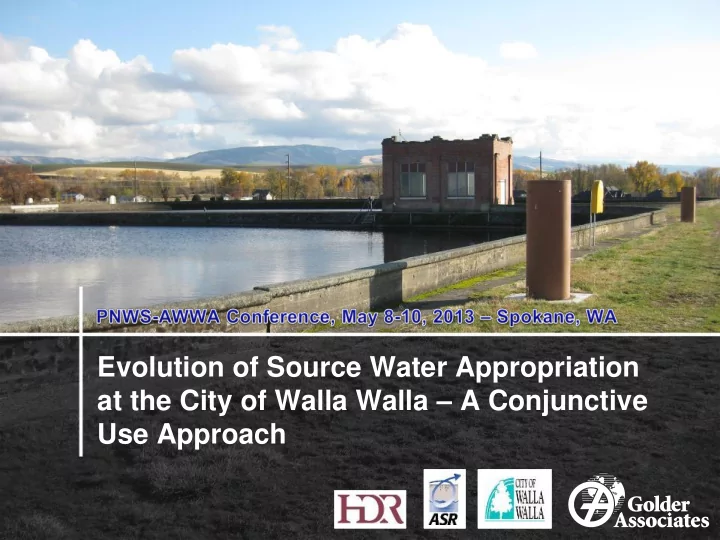

Evolution of Source Water Appropriation at the City of Walla Walla – A Conjunctive Use Approach
Presentation Overview Community Background Water System – Surface Water and Groundwater Hydropower Recycled Water Supply and Demand Projections Groundwater and ASR Operations
Background of Walla Walla Founded in 1862 City population of 32,000 Service population of 34,000 Approximately 10,500 connections ● 9,100 single family connections ● 150 multi-family ● Remaining 1,200 are commercial/industrial Main industries ● Agriculture ● Corrections facility ● Wine industry
Water System Started off as a surface water system in 1906 Uncommon feature is that the intake is Mill Creek in Oregon ● Moved into Oregon in 1922 ● City holds two Oregon surface water rights ● Treatment started as sedimentation/chlorination. Mill Creek City Watershed Washington Oregon
Groundwater Use Population growth put a strain on Mill Creek water supply. City started drilling wells to meet peak demand and back-up for drought management. Seven wells added between 1940s and 1960s. Aquifer storage and recovery (ASR) program started in 1999.
Hydropower Hydropower installed on Mill Creek pipeline in 1980s. ● 2.2 MW Pelton wheel generator ● Water from generator goes into treatment plant or diverted back into Mill Creek. Power generation is a major funding source for City Emphasis on Mill Creek use Now constrained by in-stream fish flows
Water Supply Portfolio Source Water Right (MGD) Current Capacity (MGD) Mill Creek 31 24 Well No. 1 (ASR) 3.6 3.6 Well No. 2 2.6 2.5 Well No. 3 5.8 4.1 Well No. 4 4.0 4.0 Well No. 5 2.4 2.0 Well No. 6 (ASR) 3.7 3.8 Well No. 7 (Emergency) 4.3 4.3 WW Comm. College Well 1.4 1.6 Total 59.0 49.7
Recycled Water City wastewater plant practices 100% water recycling for part of the year Land irrigation for 7 months – Gose and Blalock Irrigation Districts Recycling stopped in winter and spring ● Lack of demand ● To further enhance spring flows for fish in Mill Creek
Supply/Demand Forecasts Compounded population growth at 1% per year Total Service Area In City
Water Loss Annual Water Loss 0% 2006 2007 2008 2009 2010 -5% 2010 Production (MG) -10% 1,185 -15% -20% 2,256 -25% -30% -35% -40%
Projected Water Demand Do nothing Water main repairs Water Use Efficiency
City’s Future Intensive loss prevention program ● Water main replacement program ● Leak identification and repair Meter replacement program Water treatment plant upgrade for LT2 compliance Expanding ASR program
Walla Walla Groundwater System Seven wells developed over time to supply expanding City and augment Mill Creek Deep wells (~1,000 feet +/-) tap Columbia River Basalt Capacity 1,500 to 2,800 gallons per minute Typically seasonal use – winter turbidity or summer low flows Expanded to include two ASR wells (No. 1 and No. 6) in 1999 to 2003
Decision Behind ASR for Walla Walla Existing wells and infrastructure in place High quality surface source seasonally available Observed long-term decline in groundwater levels in basalt aquifer Redundancy and reliability of surface water source ASR program planned to: ● Reverse declining groundwater levels in the basalt aquifer ● Provide peaking water supply ● Minimize summer impacts on Mill Creek ● Provide emergency supply in case of adverse turbidity or fire in watershed
Walla Walla Groundwater System WTP and Wells 1 & 2 Well 6 Well 4 Well 5 Well 7 15 Two ASR Wells
Conceptual Hydrogeology in Walla Walla
Walla Walla Hydrogeology
Basalt Rock Types and Storage Pillow Complex – Flow Bottom Entablabuture – Flow Interior Flow Top Columnar Basalt – Flow Interior Flow Top Breccia Source: GWMA, 2009
City of Walla Walla - Permitting Completed testing according to other states’ regulations while communicating progress with Ecology ● Obtained UIC permits for ASR wells ● Ecology review of testing plans ● DOH review of wellhead modifications Retrofit two existing wells to allow ASR capability ● No adverse water quality effects since ASR program started ● Fully operational since 2002 Submitted Reservoir Permit Application in 2009 Waiting for Ecology approval
Walla Walla ASR Operations
Walla Walla ASR Operations 200 Monthly Recharge Well 1 & 6 180 Well 1 & 6 Pumping 160 140 Quantity (MG) 120 100 80 60 40 20 0 Jan-08 Jul-08 Jan-09 Jul-09 Jan-10 Jul-10 Jan-11 Jul-11 Jan-12 Jul-12
Walla Walla ASR Operations 3,000 Well 1 & 6 Net Recharge Cumulative Net Recharge 2,500 2,000 Quantity (MG) 1,500 1,000 500 0 Jan-08 Jul-08 Jan-09 Jul-09 Jan-10 Jul-10 Jan-11 Jul-11 Jan-12 Jul-12 -500
Summary Conjunctive use of surface water and groundwater benefits the environment and local community Hydropower and Recycled water systems provide community benefits Surface water maximized during spring and early summer Groundwater use maximized during summer and fall and is used during high turbidity periods in the fall and winter ASR provides opportunity for increased groundwater use and additional storage and emergency supply Overall benefits to Mill Creek and other local surface water sources
Recommend
More recommend