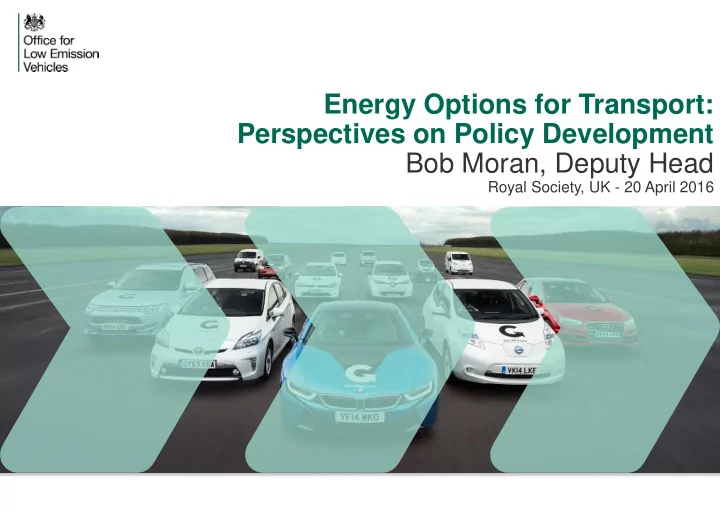

Energy Options for Transport: Perspectives on Policy Development Bob Moran, Deputy Head Royal Society, UK - 20 April 2016
Can electric cars save the world? Bob Moran, Deputy Head Royal Society, UK - 20 April 2016
Can electric cars save the world? NO. But they might help … Bob Moran, Deputy Head Royal Society, UK - 20 April 2016
Can electric cars save the world? NO. But they might help … Bob Moran, Deputy Head Royal Society, UK - 20 April 2016 1. Policy backdrop 2. Policy planning 3. Policy challenges
The Climate Change Act 2008 requires an 80% emissions reduction in the UK by 2050 (against a 1990 baseline) Legally binding ‘carbon budgets’ to cap emissions of 80% reduction in emissions required by 2050 (from 1990) 900 greenhouse gases (GHG) over rolling 5 year periods. 800 Committee on Climate Change (CCC) and Adaptation 700 Sub-Committee to advise on progress and direction. 600 UK Government duty to deliver a UK Climate Change MtCO2e 500 Risk Assessment report to Parliament every 5 years . The size of 400 the challenge 300 200 UK GHG emissions and carbon budget targets 100 900 0 800 1990 1992 1994 1996 1998 2000 2002 2004 2006 2008 2010 2012 2014 2016 2018 2020 2022 2024 2026 2028 2030 2032 2034 2036 2038 2040 2042 2044 2046 2048 2050 700 UK GHG emissions 2050 target 600 MtCO 2 e 500 400 300 200 CB5 tbc 100 0 1990 1992 1994 1996 1998 2000 2002 2004 2006 2008 2010 2012 2014 2016 2018 2020 2022 2024 2026 2028 2030 2032 2034 2036 2038 2040 2042 2044 2046 2048 2050 UK GHG emissions Carbon budget 1 Carbon budget 2 Carbon budget 3 Carbon budget 4 2050 target Energy Options for Transport – Policy Development 5 Royal Society, London - 21 April 2016
25%+ of UK total GHG emissions come from transport Domestic transport GHG emissions around Transport emissions are dominated (>90%) by 20% of total UK GHG emissions … emissions from road vehicles. We have a strategy for low emission vehicles, but this does not … up from 15% in 1990. adequately cover HGVs, which contribute a disproportionately high level of emissions. International aviation and shipping GHG emissions roughly 7% …up from 3% in 1990. Transport’s share is more than 25%. Buses and Other incl. road, Rail, 2% Coaches, 3% 3% Vans, 13% Aviation & shipping, 3% Cars & Taxis, 54% HGVs, 21% Transport GHG emissions (incl. international transport): 2013 Energy Options for Transport – Policy Development Royal Society, London - 21 April 2016 6
Range of transport initiatives to reduce carbon emissions Increasing walking in Negotiating deals on door to door journeys Aviation and Maritime Changing consumer behaviour and attitudes Introducing Greener Buses Introducing newer cleaner vehicles Increasing uptake of cycling Electrifying the railway network Increasing low emission car uptake Investing in alternative fuels Energy Options for Transport – Policy Development 7 Royal Society, London - 21 April 2016
Government has set stretching goals and increased funding MANIFESTO MAY 2015 ‘Our aim is for almost every car an van to be a zero emission vehicle by 2050 ... and we will invest £500m over the next five years to achieve it.’ SPENDING REVIEW NOVEMBER 2015 The government will spend more than £600m between 2015-16 and 2020-21 to support uptake and R&D Incentives Energy Issues Comms Infrastructure Supply Chain manufacturing of ultra-low emission vehicles (ULEVs) …and keep the UK on track for all new cars to be effectively zero emission by 2040. Energy Options for Transport – Policy Development 8 Royal Society, London - 21 April 2016
Most comprehensive policy programme in the world (?) ££££ Plug-in Car Grant ££ Incentives for other vehicles £ Go Ultra Low comms campaign ££ Go Ultra Low Cities ££ Buses ££ Taxis ££ UK EV infrastructure ££ Hydrogen (including infrastructure) ££ England EV infrastructure ££ London • Every new car an ULEV from 2040 and whole fleet by 2050; ££ Natural gas infrastructure • The right supporting infrastructure ; • World class skills and facilities for ULEV tech; £££ Research and development • A smarter electricity grid to maximise ULEV; and ££ Battery prize • The UK as the best place in Europe for ULEV industries . Energy Options for Transport – Policy Development 9 Royal Society, London - 21 April 2016
Monthly UK registrations of plug-in cars 7000 1.80 1.60 6000 Number of plug-in car registrations Percentage of all car registrations 1.40 Plug-in cars 5000 1.20 as a % of all new car registrations 4000 1.00 0.80 3000 0.60 2000 0.40 1000 0.20 0 0.00 Energy Options for Transport – Policy Development 10 Royal Society, London - 21 April 2016
New UK registrations of plug-in eligible vehicles 7000 6000 Cars Vans 5000 New registrations 4000 3000 2000 1000 0 Energy Options for Transport – Policy Development 11 Royal Society, London - 21 April 2016
Strategic challenges Creating a self-sustaining market not reliant on Government support Improving the UK consumer offer on charging infrastructure REGULATORY DEMAND Energy Options for Transport – Policy Development 12 Royal Society, London - 21 April 2016
Vehicle to Grid – benefits in first and second life CCC Cumulative EV Deployment & Associated Electricity Demand 2020 2025 2030 Vehicles 0.6m 4.3m 11.6m Energy Demand 1.1TWh 7.5TWh 18.2TWh Energy Options for Transport – Policy Development 13 Royal Society, London - 21 April 2016
And then there is the real world … Energy Options for Transport – Policy Development 14 Royal Society, London - 21 April 2016
THANK YOU www.gov.uk/olev @OLEVgovuk
Recommend
More recommend