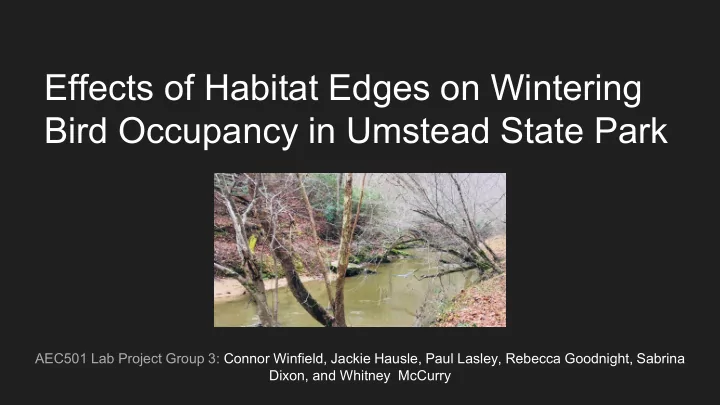

Effects of Habitat Edges on Wintering Bird Occupancy in Umstead State Park AEC501 Lab Project Group 3: Connor Winfield, Jackie Hausle, Paul Lasley, Rebecca Goodnight, Sabrina Dixon, and Whitney McCurry
Study Aims ● To further explain the effects of habitat fragmentation on urbanized landscapes. ● Analyze the differences of species composition from edge habitat (boundary) to core habitat (middle of park). ● Expand on previous research (Murcia 1995) of edge effects on species composition. ● Specifically focused on wintering bird populations in William B. Umstead State Park.
Background William B. Umstead State Park ● Located in Northwest Raleigh ● 5,600 acres of old growth forest ● 3 lakes with various creeks interspersed ● US-70 to the North ● Interstate I-40 to the South ● Raleigh-Durham International to the West ● Suburbs to the East
Question ● What are the effects on occupancy for various bird species as the distance from the park boundary increases and the surroundings shifts to a less developed core habitat?
Methods: Collection ● Three collection days ○ Mar 17 ○ Mar 18 ○ Third rep weekday between Mar 19-Mar 23 ● 3 trails - Cedar Ridge, Graylyn, and Company Mill- consistent observers ● 22 points on each trail, 100 meters apart ● Unlimited radius ● Recorded calls or sightings, presence/absence data ● Made note of number of visitors seen on each trail ● Flaws?
Methods: Analysis ● Presence 12.7 ● Focused on 11 species ● 3 models ○ Null: No Covariates ○ Distance: Distance from boundary into park, main study variable ○ Trail Use: Comparing Heavily traversed trail to less used trails ■ Confounded with observer and trail variable ● Statistics: based on maximum model likelihood estimates ○ AIC: Model selection metric ○ ΔAIC: Measurement from the top -ranked model’s AIC ○ Weight: Measure of support for each model being the best model
Results
Overview ● 39 species found ○ 34 Passerines ○ 4 Piciformes ○ 2 Accipitriformes ● 11 chosen for analysis
Naive Occupancy Compared to Expected Occupancy ● Presence adjusts for detection ○ Based on percentage of replicates where species was detected ● Disparity between Naive/Calculated indicates detection probability ○ Inverse relation
Model Reliability American Robin Mourning Dove AIC ΔAIC Weight AIC ΔAIC Weight Null 147.03 0 0.857 Null 181.26 0 0.463 Distance 152.36 5.33 0.0596 Distance 182.73 1.47 0.222 Trail Use 151.69 4.66 0.0834 Trail Use 182.03 0.77 0.315 Brown-headed Nuthatch Northern Cardinal AIC ΔAIC Weight AIC ΔAIC Weight Null 117.27 3.3 0.1204 Null 218.73 6.67 0.0356 Distance 113.97 0 0.6271 Distance 220.19 8.13 0.0172 Trail Use 115.79 1.82 0.2524 Trail Use 212.06 0 0.9499
Model Reliability Carolina Wren Pine Warbler AIC ΔAIC Weight AIC ΔAIC Weight Null 197.64 16.35 0.0003 Null 222.44 10.47 0.0053 Distance 199.48 18.19 0.0001 Distance 238.68 26.71 0 Trail Use 181.29 0 0.9996 Trail Use 211.97 0 0.9947 Dark Eyed Junco Red-Bellied Woodpecker AIC ΔAIC Weight AIC ΔAIC Weight Null 128.36 24.12 0 Null 153.63 1.4 0.2956 Distance 126.13 21.89 0 Distance 155.62 3.39 0.1093 Trail Use 104.24 0 1 Trail Use 152.23 0 0.5952
Model Reliability Eastern Towhee Tufted Titmouse AIC Weight AIC Weight ΔAIC ΔAIC Null 127 27.47 0 Null 182.26 4.57 0.0824 Distance 128.57 29.04 0 Distance 191.71 4.02 0.1084 Trail Use 99.53 0 1 Trail Use 177.69 0 0.8092 Golden Crowned Kinglet AIC ΔAIC Weight Null 155.39 45.04 0 Distance 157.02 46.67 0 Trail Use 110.35 0 1
Model Reliability: Discussion ● Preferred Model has lowest AIC ○ Preferred compared to other models, not to best possible model ● Our Results: ○ Trail Use: 8 ○ Distance: 1 ○ Null: 2
Occupancy v. Distance ● Biological significance ○ Edge species ○ Interior species ● Missing species due to presence parameters being violated
Species Breakdown Occupancy v. Distance
Species Breakdown Occupancy v. Distance
Species Breakdown Occupancy v. Distance
Discussion ● Trail use model preferred in 8 species ○ 2 light trails, 1 heavy trail: not enough replicates for significant analysis ○ Confounded with observer skill variable as well ● Surprising detection probability results? ○ Robin detection much lower than Dark Eyed Junco? ■ Why? ● Observer Bias ● Sampling Bias
Discussion ● Estimates of occupancy at set distances ○ Some species had naive occupancy of 1 (across 9 reps for each set distance) ○ So can’t run analysis ● Most statistically insignificant ○ American Robin, Dark-Eyed Junco show statistically significant differences in occupancy between outermost and innermost data points
Acknowledgements ● Ted Simons for 99% of our avian identification knowledge ● Shilo Felton and Mike Cove for Presence Instruction and Troubleshooting ● Shilo Felton for constructive criticism along the way
Literature Cited Blair, R. B. (1996), Land Use and Avian Species Diversity Along an Urban Gradient. Ecological Applications, 6: 506– 519. doi:10.2307/2269387 Ewers, R. and Didham, R. (2005). Confounding factors in the detection of species responses to habitat fragmentation. Biological Reviews, 81(01), p.117. Murcia, C.1995. Edge Effects in Fragmented Forests: Implications for Conservation. Trends in Ecology & Evolution 10:58- 62. Zurita, G., Pe’er, G., Bellocq, M. and Hansbauer, M. (2012). Edge effects and their influence on habitat suitability calculations: a continuous approach applied to birds of the Atlantic forest. Journal of Applied Ecology, 49(2), pp.503-512.
Recommend
More recommend