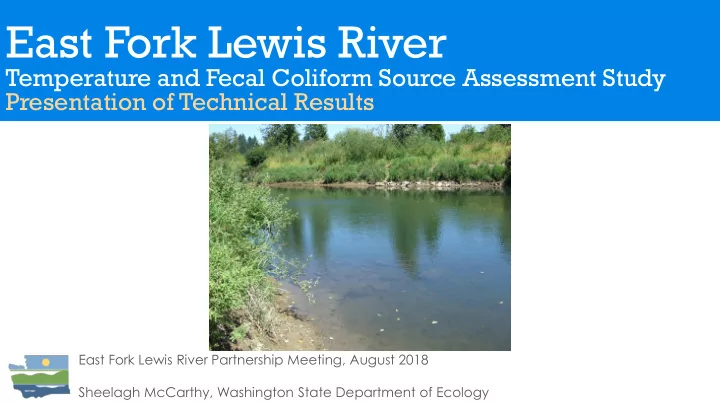

East Fork Lewis River Temperature and Fecal Coliform Source Assessment Study Presentation of Technical Results East Fork Lewis River Partnership Meeting, August 2018 Sheelagh McCarthy, Washington State Department of Ecology
2004 East Fork Lewis River selected for TMDL Quality Assurance Project Plan East Fork Lewis River Temperature and Fecal 2005-06 Coliform Bacteria (Bilhimer et al., 2005) + Sampling (bacteria and temperature) Streamflow Summary for Gaging Stations on the East Fork Lewis River, 2005-06 2009 (Springer, 2009) Surface Water/Groundwater Exchange Along the East Fork Lewis River, 2005 (Carey and Bilhimer, 2009) 2016 East Fork Lewis River selected for Source Assessment Quality Assurance Project Plan East Fork Lewis River Fecal Coliform Bacteria and 2017 Temperature Source Assessment (Raunig and McCarthy, 2017) + Sampling (bacteria) 2018 East Fork Lewis River Temperature and Fecal Coliform Bacteria Source Assessment Report (McCarthy, 2018) https://ecology.wa.gov/Water-Shorelines/Water-quality/Water-improvement/Total- Maximum-Daily-Load-process/Directory-of-improvement-projects/East-Fork-Lewis-River
East Fork Lewis River Watershed
Project Goals Confirm and identify sources of fecal coliform bacteria to the East • Fork Lewis River watershed. Assess existing shade and identify areas with the largest shade • deficits along the East Fork Lewis River to help prioritize implementation strategies. Provide information on key areas to focus implementation efforts. • MAS3.19 BRZ SW2 MCC1.18
Fecal Coliform Bacteria
Seasons Dry Season Wet Season June - October November - May McCormick Creek (MCC 3.4)
Bacteria Sampling Results 2005-06 2017
Bacteria Seasonal Loading 𝑀𝑝𝑏𝑒((𝑐𝑗𝑚𝑚𝑗𝑝𝑜 𝑑𝑔𝑣)/𝑒𝑏𝑧) = 𝐶𝑏𝑑𝑢𝑓𝑠𝑗𝑏 𝐷𝑝𝑜𝑑𝑓𝑜𝑢𝑠𝑏𝑢𝑗𝑝𝑜 ( 𝑑𝑔𝑣 100𝑛𝑀) ∗ 𝐺𝑚𝑝𝑥 𝑑𝑔𝑡 ∗ 𝐷𝑝𝑜𝑤𝑓𝑠𝑡𝑗𝑝𝑜 𝐺𝑏𝑑𝑢𝑝𝑠
Bacteria Recommended Reductions Completed using Statistical Rollback Analysis
Temperature
Temperature Results 7-DADMax is the 7-day average of the daily maximum temperatures
Measuring Effective Shade
Shade Analysis Results Shade Deficit (%) = Potential Shade (%) – Current Effective Shade (%) Detailed methodology in QAPP (Raunig and McCarthy, 2017) and Report (McCarthy, 2018)
Questions? East Fork Lewis River Website Sheelagh McCarthy shem461@ecy.wa.gov Source Assessment Report Author Devan Rostorfer dros461@ecy.wa.gov East Fork Lewis River TMDL Lead
Recommend
More recommend