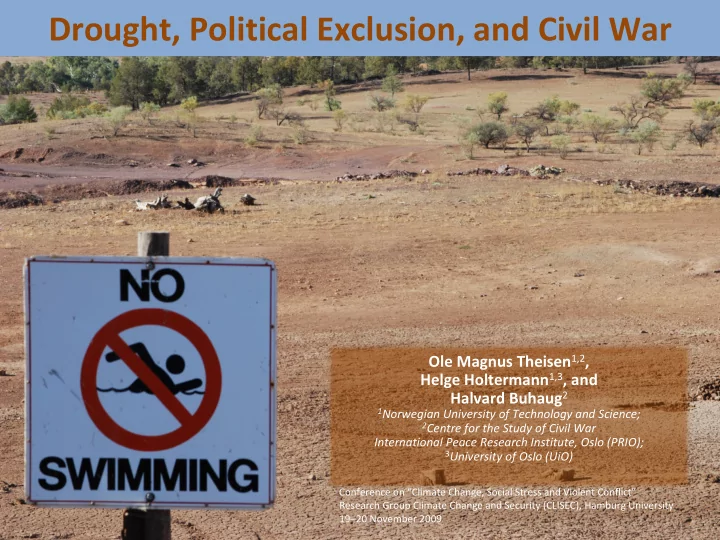

Drought, Political Exclusion, and Civil War Ole Magnus Theisen 1,2 , Helge Holtermann 1,3 , and Halvard Buhaug 2 1 Norwegian University of Technology and Science; 2 Centre for the Study of Civil War International Peace Research Institute, Oslo (PRIO); 3 University of Oslo (UiO) Conference on “Climate Change, Social Stress and Violent Conflict” Research Group Climate Change and Security (CLISEC), Hamburg University 19–20 November 2009
Motivation • Abrupt climate change may lead humanity into “constant battles for diminishing resources” (Schwartz & Randall, 2003) • Climate change is an “all ‐ encompassing threat” to human health, to global food supply, and to peace and security (Annan, 2006) • “Climate change will help produce [..] insurgencies, genocide, guerrilla attacks, gang warfare, and global terrorism” (Homer ‐ Dixon, 2007) • Darfur is the first of many climate wars (Ban Ki ‐ Moon on various occasions) • Climate change may result in “increased danger of violent conflicts and wars, within and between states” (Mjøs, 2007) • Climate change, through drought and crop failure, “breeds hunger and conflict” (Obama, 2009)
Trends in climate change and armed conflict
Armed conflicts across the globe
Africa • 1/3 of African people live in drought ‐ prone regions • Only 4% of arable land in SSA is irrigated • Large agricultural sector, subsistence economies • Home to almost half of all active armed conflicts • Global warming is likely to lead to a drying of northern and southern Africa; East Africa might get more rain General acceptance that Africa will be affected by future global warming first and most severely
Previous research • Case ‐ based Environmental Security literature contains several narratives of violent conflict within the context of resource competition and environmental degradation • Quantitative research on a scarcity ‐ conflict connection suffers from poor data and inappropriate research designs • Some indication that rainfall ’shocks’ increase risk of civil war through poor economic growth (Miguel et al. 2004) • Incompatibilities of scale: case literature studies local dynamics, large ‐ N literature focuses on countries • Political conditions often downplayed or ignored; yet, almost all allegedly scarcity ‐ driven conflicts involve politically marginalized populations, and these populations are those hardest hit by shocks
Research design • Ambition: provide a rigorous empirical test of central Environmental Security propositions: – Drought increases the local risk of civil armed conflict – The risk ‐ inducing effect of drought is strongest in areas inhabited by politically marginalized populations • Sample: Africa 1960 ‐ 2006 • Unit of analysis: 0.5° grid cell, yearly observations • Dependent variable: armed intrastate conflict outbreak (geocoded) (UCDP/PRIO armed conflict data. >25 battle ‐ deaths threshold.) • Numerours measures of annual precipitation deviations plus drought indicators (SPI) that capture within ‐ year variations
PRIO Grid 0.5° resolution Africa = 10,683 cells
Average annual precipitation Precipitation data: Global Precipitation Climatology Centre (GPCC)
Changes in precipitation, 1951 ‐ 2004
Preliminary inspection Ethnic Group in Power Marginalized Ethnic Group No drought t ‐ 1 Drought t ‐ 1 No drought t ‐ 1 Drought t ‐ 1 No onset 101,257 23,104 190,487 43,328 (99.972%) (99.991%) (100%) (99.980%) 39 Onset 9 0 12 (0.020%) (0.009%) (0%) (0.028%) Total 101,266 23,104 190,526 43,340 (100%) (100%) (100%) (100%)
Full model (1) (2) (3) VARIABLES onset onset onset SPI drought current year ‐ 0.377 ‐ 0.364 (0.339) (0.357) EGIP ‐ 1.364** ‐ 1.381** ‐ 1.368** (0.419) (0.421) (0.454) EGIP × SPI ‐ drought ‐ 0.107 (1.152) Distance to border (ln) ‐ 0.287** ‐ 0.288** ‐ 0.288** (0.097) (0.098) (0.098) Capital city 1.970** 2.003** 1.999** (0.484) (0.476) (0.480) Population cell (log) 0.445** 0.447** 0.447** (0.097) (0.097) (0.097) GDP per capita t ‐ 1 (log) ‐ 0.232 ‐ 0.235 ‐ 0.235 (0.226) (0.228) (0.229) Polity2 t ‐ 1 0.004 0.005 0.005 (0.022) (0.022) (0.022) Brevity of peace ‐ 0.094 ‐ 0.088 ‐ 0.088 (0.403) (0.407) (0.407) Constant ‐ 7.062** ‐ 6.990** ‐ 7.000** (2.177) (2.188) (2.205) Observations 18,214 18,214 18,214 Log pseudolikelihood ‐ 355.589 ‐ 355.023 ‐ 355.019
Drought measures VARIABLES Coefficient Std. err. Drought, t ‐ 0.377 (0.339) Drought, t ‐ 1 ‐ 0.083 (0.304) Drought, t ‐ 2 0.190 (0.276) Drought recorded in t ‐ 3 to t period 0.155 (0.278) Number of drought events from t ‐ 4 to t ‐ 0.007 (0.099) Distance to nearest drought event, t (log) 0.028 (0.054) Distance to nearest drought event, t ‐ 1 (log) 0.023 (0.061) Distance to nearest drought event, t ‐ 2 (log) ‐ 0.021 (0.065)
Table 2: Drought measures (cont’d) VARIABLES Coefficient Std. err. Rainfall deviation from mean, t (%) 0.002 (0.005) Rainfall deviation from mean, t ‐ 1 (%) ‐ 0.006 (0.004) Rainfall deviation from mean, t ‐ 2 (%) ‐ 0.001 (0.009) Δ Rainfall, t (%) 0.392 (0.258) Δ Rainfall, t ‐ 1 (%) 0.196 (0.464) Δ Rainfall, t ‐ 2 (%) 0.352 (0.699) UNEP drought, t ‐ 0.988 (1.060) UNEP drought, t ‐ 1 ‐ 1.062 (1.063) UNEP drought, t ‐ 2 ‐ 0.214 (0.744) Numerous interaction effects (notably political exclusion, poverty, democracy) and alternative sample inclusion criteria also explored without finding any significant coefficients
Preliminary conclusions • No evidence that below ‐ average precipitation or severe drought events have a systematic bearing on the risk of civil war onset in Africa – Droughts are frequent, conflicts are rare – Long ‐ term effects and migration not explored • Political exclusion is a powerful risk factor that should not be ignored • Future priorities: – Get better data on environmental vulnerability – Excplore consequences of drought for conflict dynamics – Explore consequences of conflict for vulnerability (famine, diseases, etc) – Explore other forms of violent conflict (e.g. communal conficts) – Couple with data on likely changes in future precipitation patterns
Recommend
More recommend