
Devin Flawd PhD Student Centre for Fisheries Ecosystems Research, Marine Institute of Memorial University of Newfoundland 1
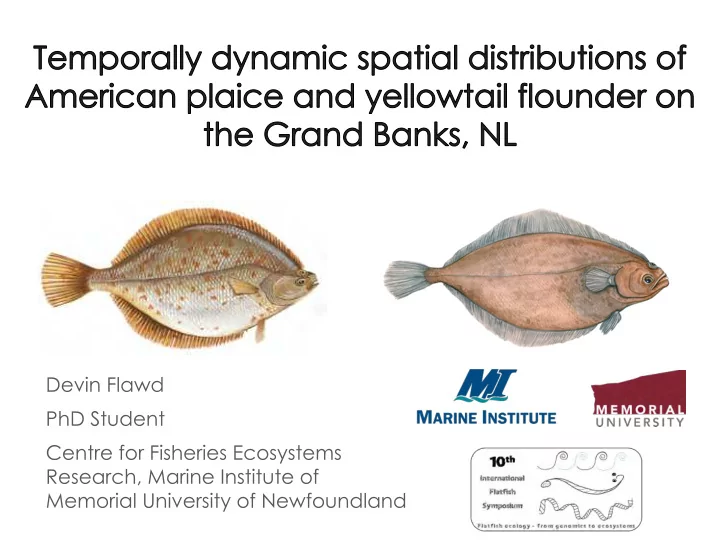
Problem and Background ´ Groundfish stock collapse ´ Flatfish stock declines in the Grand Banks ´ Collapse in the late 1980’s, early 1990’s ´ Moratorium enacted in 1995 ´ Differential recovery rates post-collapse Yellowtail flounder American plaice
(Parsons et al. 2015) (Dwyer et al. 2014) Yellowtail flounder American plaice
Problem and Background ´ Flatfish stock declines in the Grand Banks ´ Commercially important species - exploitation with bycatch ´ Collapse in the late 1980’s, early 1990’s ´ Differential recovery rates post-collapse (moratorium enacted in 1995) ´ Role of life history characteristics Yellowtail flounder American plaice
Fisheries/Species Overview Yellowtail flounder American plaice ´ Overfished in NAFO Divisions 3NO ´ Overfished in NAFO Divisions 3LNO ´ Rapid recovery after 5 years ´ 30+ years, no recovery ´ MSC certified since 2011 ´ Bycatch in yellowtail fishery ´ 10-12 years, 500 mm TL ´ 15-20 years, 1000 mm TL ´ Depth: 25 – 200 m ´ Depth: 100-500, up to 1000 m ´ Temperature: 3 – 5°C ´ Temperature: -1 – 4°C Spatial response in recovery?
Spatial Dynamics ´ Spatial response to population change ´ Density-Range relationships
Key Concepts High abundance 9 Low abundance Core area Total area From Shepherd and Litvak (2004)
Research Questions ´ For each species: ´ Biomass associations: Depth and Bottom Temperature ´ Species geographic range ´ Spatial scale ´ Total area vs. Core areas
Methods ´ Canada Department of Fisheries and Oceans ´ Long-term bottom trawl multispecies survey ´ 1985-2015 ´ NAFO divisions 3LNO ´ Geographic Range ´ Area of occupancy (trawl area) ´ Spatial Scales ´ Kernel density estimation (biomass) ´ Biomass associations: Depth and Bottom Temperature ´ Generalized additive modeling ´ Deviance explained
Species Yellowtail Flounder American Plaice Time Scale (Years) 1985-1992 1993-2000 2001-2008 2009-2015
(Parsons et al. 2015) (Dwyer et al. 2014) Yellowtail flounder American plaice
Species Yellowtail Flounder American Plaice 14 Time Scale (Years) 1985-1992 1993-2000 2001-2008 2009-2015 Spatial Scale Total Top 50% Top 25% Top 10%
Spatial Scales 50% 25% 10%
Species Yellowtail Flounder American Plaice 16 Time Scale (Years) 1985-1992 1993-2000 2001-2008 2009-2015 Spatial Scale Total Top 50% Top 25% Top 10% Seasonality Combined Fall Spring
Spatial Scale Maps 1985-1992 2009-2015 (Fall) (Fall) 10% 25% 50% 1985-1992 2009-2015 (Spring) (Spring)
1985-1992 2009-2015 (Fall) (Fall) 10% 25% 50% 1985-1992 2009-2015 (Spring) (Spring)
Geographic Range
Generalized Additive Models Canadian Conference for Fisheries Research 2017
21 Canadian Conference for Fisheries Research 2017
Total Area Core Area Deviance Explained Temp Depth Time
Total Area Core Area Deviance Explained Temp Depth Time
Key Concepts 24 From Shepherd and Litvak (2004)
25 2009-2015 1985-1992 Bottom.Temp (Fall) (Fall) -1.6 – -0.4 -0.4 – 0.8 0.8 – 2 2 – 3.2 3.2 – 4.4 4.4 – 5.6 5.6 – 6.8 6.8 – 8 1985-1992 2009-2015 (Spring) (Spring)
Why is this important? ´ Fisheries management ´ Stock spatial structures ´ Temperature/depth associations ´ Contingent sub-populations ´ Cumulative effects (F, diet, traits) ´ Consider mixed fisheries ´ Further Research Questions ´ Age/length dependencies ´ Reproduction/spawning
Advisor Thank You! Dr. Jonathan Fisher – MUN Collaborators Dr. Noel Cadigan – MUN Dr. Dominique Robert – UQAR Dr. Rick Rideout - DFO
Methods 28 ´ Area of occupancy f f 𝐵𝑝𝑃 = c c 𝑏 F 1 𝑗𝑔 𝑧 g ≥ 1 ∗ 𝐽 𝐽 = 𝑜 F 0 𝑝𝑢ℎ𝑓𝑠𝑥𝑗𝑡𝑓 𝑥ℎ𝑓𝑠𝑓 F g ´ Kernel density estimation ´ Bandwidth = ~20 km² ´ Generalized additive modeling ´ (ℎ C ) 𝑍 F = 𝛾 H ´ (ℎ I ) 𝑍 F = 𝛾 H + 𝑡 𝐸𝑓𝑞𝑢ℎ + 𝑡 𝐶𝑝𝑢𝑢𝑝𝑛 𝑈𝑓𝑛𝑞 + 𝑀𝑏𝑢𝑗𝑢𝑣𝑒𝑓 + 𝑀𝑝𝑜𝑗𝑢𝑣𝑒𝑓 + 𝑡(𝑍𝑓𝑏𝑠) ´ (ℎ \] ) 𝑍 F = 𝛾 H + 𝑡 𝐸𝑓𝑞𝑢ℎ 𝐸 = 𝐸𝑓𝑤 ℎ \ − 𝐸𝑓𝑤(ℎ I ) ´ ℎ \^ 𝑍 F = 𝛾 H + 𝑡 𝐶𝑝𝑢𝑢𝑝𝑛 𝑈𝑓𝑛𝑞 𝐸𝑓𝑤(ℎ C ) From Wood (2006)
1985-1992 2009-2015 Bottom Temperature 29 Depth
1985-1992 2009-2015 Bottom Temperature 30 Depth
Chapter 2: Spatiotemporal changes in AP yellowtail flounder and American plaice 31 populations on the Grand Bank using comparative spatial analysis techniques ´ Results YF
Results 32
Bottom Temperature 1985-1992 2009-2015 3L 3L 33 3N 3N 3O 3O
Recommend
More recommend