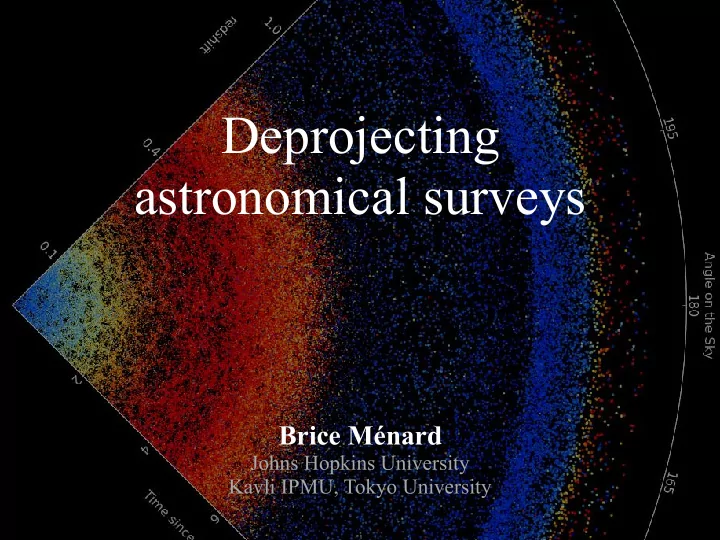

Deprojecting astronomical surveys Brice Ménard Johns Hopkins University Kavli IPMU, Tokyo University
photometry 10 10 10 9 spectroscopy Number of 10 8 sources 10 7 10 6 10 5 10 4 time 2000 2005 2017 2025 2MASS SDSS Sumire Euclid
Spectroscopic redshift Photometric redshift F wavelength wavelength
imaging spectroscopy F 1 F 2 F 3 F 4 F 5 flux wavelength wavelength 1% 99%
lookback time [billion years] Mendez & Ménard
How much information goes into the catalogs? The photometric space main data product: working environment: pixel based object based reduced photometric space brightness ra,dec size ellipticity … N~4 colors Dimensionality ~ 10-20
DECaLS survey PIs: Dey & Schlegel Visualization: D. Lang
DECaLS survey PIs: Dey & Schlegel Visualization: D. Lang
DECaLS survey PIs: Dey & Schlegel Visualization: D. Lang Huge dimensionality reduction
Mapping the photometric space to redshift space Photometric space Dim ~ 10 brightness p( z | photometry ) ra,dec redshift space size Dim = 1 ellipticity … N~4 colors
Mapping the photometric space to redshift space Photometric space Dim ~ 10 brightness ra,dec redshift space size Dim = 1 ellipticity … N~4 colors Photometric Redshifts p( z | colors, SED templates )
Mapping the photometric space to redshift space Hildebrandt et al. Photometric space Dim ~ 10 brightness ra,dec redshift space size Dim = 1 ellipticity … N~4 colors Photometric Redshifts p( z | colors, SED templates )
Mapping the photometric space to redshift space Clustering Redshifts p( z | photometry, density field ) Photometric space Dim ~ 10 brightness ra,dec redshift space size Dim = 1 ellipticity … N~4 colors Photometric Redshifts p( z | colors, SED templates )
? < ∂ i . ∂ unknown >
? < ∂ i . ∂ unknown >
∂ i fingerprint minutiae Probability for two different fingerprints to match ~ 1/68 billion Galton (1892)
The clustering redshift technique The idea: We can locate the unknown sample through a series of angular cross-correlations with a reference, spectroscopic sample The limitation: known dN/dz b(z) redshift redshift
Applications of clustering redshifts ~100 million galaxies at SDSS optical x ∆ z 2MASS near infrared spectroscopic galaxy sample WISE infrared r < 18 mag 1 million objects Planck millimetric
Rahman, BM et al. (2015)
Clustering redshift Spectroscopic redshift Rahman, BM et al. (2015)
Photometrically-selected galaxies = 1 sample 1: 0.5 < g-r < 0.6 ~ 6,300 galaxies sample 2: 1.3 < g-i < 1.4 ~ 10,000 galaxies sample 3: 1.2 < g-r < 1.3 ~ 2,500 galaxies Rahman, BM et al. (2015)
Generalization to one million galaxies = 1 Rahman, BM et al. (2015)
Generalization to one million galaxies 40 Rahman, BM et al. (2015)
Comparison to photometric redshifts sample 2 sample 3 SDSS KD-tree photometric redshifts Rahman, BM et al. (2015)
Applications of clustering redshifts ~100 million galaxies at SDSS optical x ∆ z 2MASS near infrared Entire photometric sample WISE infrared r < 22 mag 100 million objects Planck millimetric
Photometrically-selected galaxies sample 1: 0.53 < r-i < 0.54 1.6 million galaxies sample 3: 0.60 < r-i < 0.62 1.2 million galaxies sample 3: 0.90 < r-i < 0.92 0.2 million galaxies Rahman et al. (2015)
clustering redshift color `
clustering redshift color
Redshift distribution of 100 million SDSS galaxies
Applications of clustering redshifts SDSS optical J H K 2MASS near infrared 1.0 1.5 2.0 2.5 λ [ µ m] 2MASS K < 14 mag WISE infrared 1.5 million extended sources 470 million point sources Planck millimetric
Skrutskie et al. (2006) Observations: 1997-2001, J, H & K bands mean cluster-z
extended extended sources
extended point sources
Applications of clustering redshifts SDSS optical 2MASS near infrared PSF ~ 6 arcsec WISE mostly point sources infrared W1(3 µm) < 16 mag Planck millions of objects millimetric
The Wide-field Infrared Survey Explorer (WISE) Full sky survey • galaxies • stars 500,000,000 sources: • quasars • asteroids
WISE Wright et al. clustering redshift Clustering redshifts as a function of color: W1-W2 > preliminary (Alex Mendez, Donghui Jeong) W1 - W2
Applications of clustering redshifts SDSS optical 2MASS near infrared PSF ~ 6 arcsec WISE mostly point sources infrared W1(3 µm) < 16 mag Planck millions of objects millimetric
Planck CMB - SMICA map cross-correlation signal redshift Schmidt, Ménard et al. (2014)
Planck CO map J=0-1 cross-correlation signal redshift Schmidt, Ménard et al. (2014)
Planck dust opacity map cross-correlation signal redshift Schmidt, Ménard et al. (2014)
SDSS optical Planck millimetric 2MASS near infrared WISE infrared 0 1 2 3 4 5 redshift UV (GALEX), radio (FIRST, NVSS, …), Gamma rays (Fermi), … as well as combinations of datasets
Clustering redshifts summary Cluster-z We have a new tool in hand to Photometric redshift space estimate the redshifts of photometric sources Photo-z We do not have to rely on source colors to estimate redshifts. We now have two independent estimation techniques.
Clustering redshifts summary Cluster-z We have a new tool in hand to Photometric redshift space estimate the redshifts of photometric sources Photo-z We can now “deproject” cluster-z any photometric dataset, at any wavelength. color color color color
Recommend
More recommend