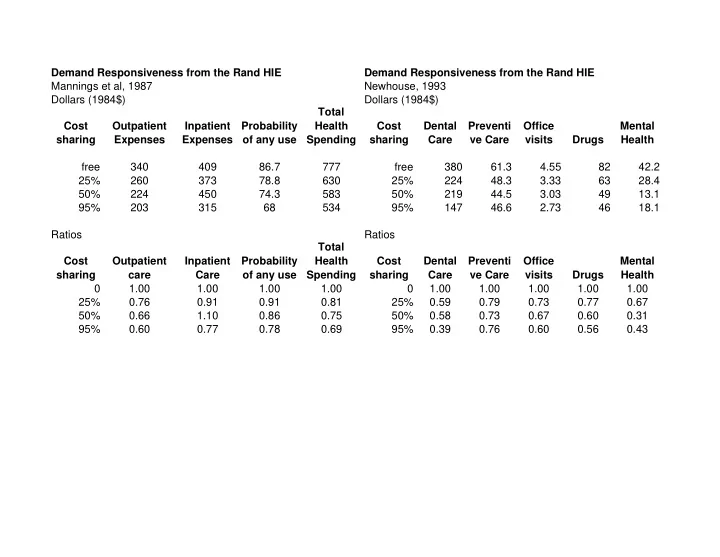

Demand Responsiveness from the Rand HIE Demand Responsiveness from the Rand HIE Mannings et al, 1987 Newhouse, 1993 Dollars (1984$) Dollars (1984$) Total Cost Outpatient Inpatient Probability Health Cost Dental Preventi Office Mental sharing Expenses Expenses of any use Spending sharing Care ve Care visits Drugs Health free 340 409 86.7 777 free 380 61.3 4.55 82 42.2 25% 260 373 78.8 630 25% 224 48.3 3.33 63 28.4 50% 224 450 74.3 583 50% 219 44.5 3.03 49 13.1 95% 203 315 68 534 95% 147 46.6 2.73 46 18.1 Ratios Ratios Total Cost Outpatient Inpatient Probability Health Cost Dental Preventi Office Mental sharing care Care of any use Spending sharing Care ve Care visits Drugs Health 0 1.00 1.00 1.00 1.00 0 1.00 1.00 1.00 1.00 1.00 25% 0.76 0.91 0.91 0.81 25% 0.59 0.79 0.73 0.77 0.67 50% 0.66 1.10 0.86 0.75 50% 0.58 0.73 0.67 0.60 0.31 95% 0.60 0.77 0.78 0.69 95% 0.39 0.76 0.60 0.56 0.43
Demand curves from the Rand HIE: Total spending, outpatient care, inpatient care, and probability of any use versus cost sharing rate 1 0.9 0.8 Consumer cost sharing 0.7 Outpatient care 0.6 Inpatient Care 0.5 Probability of any use 0.4 Total Health Spending 0.3 0.2 0.1 0 0.00 0.20 0.40 0.60 0.80 1.00 1.20 Proportion of Free care spending level
Demand curves for varius types of spending versus cost sharing rate, Rand Health Insurance Experiment, from Newhouse, 1993 1 0.9 0.8 0.7 Cost sharing rate Dental Care 0.6 Preventive Care 0.5 Office visits Drugs 0.4 Mental Health 0.3 0.2 0.1 0 0.00 0.20 0.40 0.60 0.80 1.00 1.20 Proportion of Free care level
Recommend
More recommend