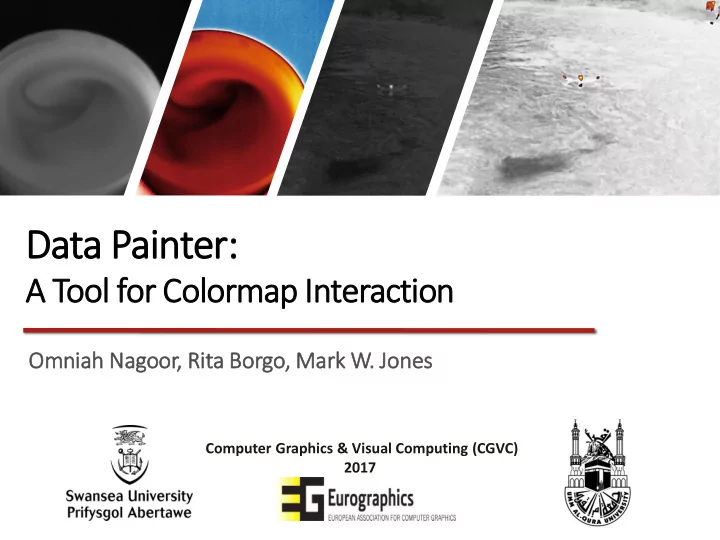

Data Painter: A Tool for Colormap Interaction Omnia iah Na Nagoor, Ri Rita Bor orgo, Mar ark W. Jon Jones Computer Graphics & Visual Computing (CGVC) 2017
Introduction • Colormap in visualization. • Most common scalar-to-color functions are: color look-up table and transfer function. • Factors for selecting a representative colormap. • Existing software use standard colormaps (i.e. sequential, divergent, qualitative). 2
Related Work ZHOU L., HANSEN C. D.: A survey of colormaps in visualization. IEEE Transactions on Visualization and Computer Graphics 22 , 8 (Aug 2016), 2051 – 2069. doi:10.1109/TVCG.2015.2489649. [LKG ∗ 16] LJUNG P., KRÜGER J., GROLLER E., HADWIGER M., HANSEN C. D., YNNERMAN A.: State of the art in transfer functions for direct volume rendering. Computer Graphics Forum 35, 3 (2016), 669–691. doi:10.1111/cgf.12934. WALDIN N., BERNHARD M., RAUTEK P., VIOLA I.: Personalized 2D color maps. Computers & Graphics 59 (2016), 143 – 150. doi:10.1016/j.cag.2016.06.004. 3
Related Work FANG H., WALTON S., DELAHAYE E., HARRIS J., STOR- CHAK D. A., CHEN M.: Categorical colormap optimization with visualization case studies. IEEE Transactions on Visualization and Computer Graphics 23, 1 (Jan 2017), 871–880. doi:10.1109/TVCG.2016. 2599214 . THOMPSON D., BENNETT J., SESHADHRI C., PINAR A.: A provably- robust sampling method for generating colormaps of large data. In 2013 IEEE Symposium on Large-Scale Data Analysis and Visualization (LDAV) (Oct 2013), pp. 77 – 84. doi:10.1109/LDAV.2013. 6675161. AKYÜZ A. O., KAYA O.: A proposed methodology for evaluating hdr false color maps. ACM Trans. Appl. Percept. 14, 1 (July 2016), 2:1–2:18. doi:10.1145/2911986. 4
Motivation • Finding informative colormaps is challenging even through the existence of the standard colormaps. • Each colormap performs well depending on the given goals and the nature of datasets. • Narrow ranges within dataset, may require multiple colormaps to reveal its features. • There is a need for tools that: ❖ Maximize the perceptual reach of the data using colormap. ❖ Allows users to customized more dense colormaps with interactive and user-friendly interface. 5
Application Overview Input Interactive Interface Output Dataset 2D rendered Image with the customized Us User er cus customizing colo lormap colormap 6
Main Interface Ren endering Res esult Window Hi Histogram Pl Plotting ar area Customizing menu Interactive colormap bar 7
Basic Interactions & Features • Create a new colormap • Change colormap • Resize colormap • Delete a colormap • Zoom in/out • Move the colormap (translate) 8
Basic Interactions & Features (Data-based) Filtering 9
Basic Interactions & Features (I (Image-based) Fi Filterin ing 10
Basic Interactions & Features • The user discover an interesting feature within this small range of the dataset and placed a new colormap. • Repeatedly interacting through the interface, the user will create a customized colormap that reveals the dataset hidden features. • Such procedure guides the process of finding and effective and representative colormap in less time. 11
Objective Evaluation ➢ We construct an objective evaluation for measuring the effectiveness of the colormapping using three different measurements • For data source 𝑔 𝐸 𝑦, 𝑧 , and colormapped image 𝑔 𝐷 𝑦, 𝑧 ′ = 𝜖𝑔 𝐸 ′ = 𝜖𝑔 𝐸 • The gradient is 𝛼𝑔 𝐸 𝑦, 𝑧 = 𝑔 𝜖𝑦 , 𝑔 𝑦 𝑧 𝜖𝑧 differences 𝜖𝑔 𝐸 𝜖𝑦 = 𝑔 𝐸 𝑦+𝑒 − 𝑔 𝐸 (𝑦−𝑒) • Central , 𝑒 = 1 (𝑞𝑗𝑦𝑓𝑚 𝑜𝑓𝑗𝑐𝑝𝑠𝑡) 2𝑒 1 • 𝐸 (𝑦, 𝑧) ) 2 Mean Squared Error 𝑜 σ( 𝛼𝑔 𝑁𝑇𝐹 𝐷 = 𝐷 (𝑦, 𝑧) − 𝛼𝑔 • ∆𝐹 𝐷𝐽𝐹00 metric provided by [AK16] and supported by their user study. They measure the number of pixel pairs where ∆𝐹 𝐷𝐽𝐹00 > 1 12
Objective Evaluation • For a set of 50,000 random points without replacement the gradient direction and magnitude for different colormaps is compared against the ground truth. Distance field mapped using multiple linear colormap divergent colormap with 50,000 random points 13
Objective Evaluation 1. MSE is the estimated gradient from the colormap to the gradient estimated from the data ( smaller is better ). indicates the percentage of vectors that are within ±10 𝜋 of 2. The angle the estimated gradient from the original data ( larger is better ). 3. The percentage of pixel pairs satisfying ∆𝐹 𝐷𝐽𝐹00 > 1, which is a great indicator that of perceiving difference between those pixel pairs ( larger is better ). 14
Case Study • Thermal image data has a larger dynamic range. • They are useful as a diagnostic tool for building issues, or other insulation problems. • In these cases, fault detection requires good contrast to surrounding background temperature. • By interacting with our framework for few seconds, the user is able to create a customize colormap, which highlights more features and structural details. 15
Case Study • The results of running the objective evaluation on the image illustrates that the user defined colormap has: ❖ The lowest MSE on the gradient. ❖ The highest agreement between colormap derived gradient 𝛼𝑔 𝐷 𝑦, 𝑧 and data gradient 𝛼𝑔 𝐸 𝑦, 𝑧 . ❖ Produced a more accurate representation of the gradients in the image. • These are indications of the usefulness of our approach. 16
Conclusion & Future Work • We provide a framework that: has interactive and user-friendly interface. ❖ ❖ guides the process of finding and effective and representative colormap in very limited time. • Result demonstrates improvement in: ❖ the perceptual reach (highlight more features and structural details). ❖ the cognitive process. • The effectiveness of our tool was evaluated using an objective evaluation, which we aim to evaluate using user study in the future work. 17
18
Thank You Any Questions? 19
Recommend
More recommend