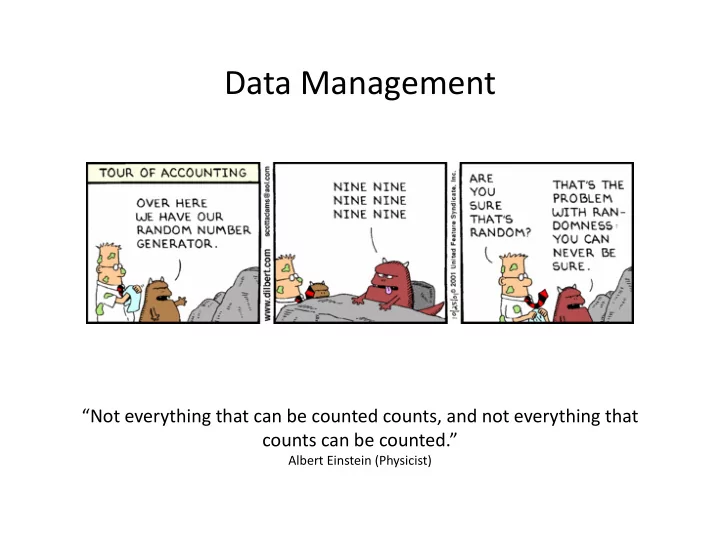

Data Management “Not everything that can be counted counts, and not everything that counts can be counted.” Albert Einstein (Physicist)
Golden rules for data tables 1. A row represents a unit – All measurements of a unit should normally be in the same row. – Different units must be in different rows. – Important to think about what your units are
Golden rules for data tables 2. If in doubt, add more rows – If possible, use categorical (character) variables to indicate the independent effects (treatments, environments). – Repeat measurement (e.g. time series data) normally get individual rows (e.g. time is added as a column) – It is always easy to convert a long table to a wide table (Excel Pivot), but not vice versa.
Golden rules for data tables 3. Use strong IDs
Weak IDs
Strong IDs
Golden rules for data tables 4. A column represents a variable – Each column is a different independent or dependent variable – Every column has to have a name • Don’t start names with symbols or numbers • Avoid duplicate columns names • Avoid units – keep them as meta data
Golden rules for data tables 5. Keep a metafile with information about your datafile – If possible, keep record of how your data was collected • latitude/longitude of sites, slope, aspect • who collected it – Keep record of useful information • What each of your variable names stand for • Measurement units • resolution of spatial files
Golden rules for data tables 6. Modify your raw data entries with R scripts – Easy to do a change something and re-run the analysis (e.g. with or without outliers) – Hunting down and fixing errors is efficient, because script leaves a perfect trail of what you did – Save yourself from repetitive tasks (that likely introduce errors)
The Data Table Concept Type 1: Multiple populations Crop variety Dependent variables Sample of population that you want to learn something about
The Data Table Concept Type 2: Single populations Independent variables Dependent variable You can think of this representing a population: crop grown without fertilizer
Variable/Data types • Nominal : qualitative measurement where categories or numbers ONLY label the object being measured or identify the object as belonging to a category E.g. - Forest plots identified by 1-10 or by location - Qualitative categories: Low-Medium-High or Male/Female, etc. Don’t calculate statistics – how do you take a mean of male/female? • Ordinal: quantitative measurement that indicates a relative amount, arranged in rank order, but DOES NOT imply and equal distance between points E.g. – Ranking of growth performance of 10 trees, where 1 is worst and 10 is best Percentiles or Non-parametric statistics ONLY • Interval: quantitative measurement that indicates BOTH the order of magnitude AND implies equal intervals between the measurements. NOTE: These measurements have ARBITRARY ZEROS E.g. – Temperature ( ◦ C) All statistics allowed , but no × or ÷ (alternative % change) • Ratio: quantitative measurement where numbers indicate a measure with EQUAL intervals and a TRUE ZERO E.g. – Precipitation (156mm) – Frequencies (counts of just about anything) All statistics allowed
Variable/Data types • Discrete: values may only fall at particular points on the scale of measurement and cannot exist between points E.g. Number of trees, number of cones, etc. • Continuous: values can fall anywhere on an unbroken scale of measurements with real limits E.g. temperature, height, volume of fertilizer, etc.
Learning Objectives - Lab 2 • Learn a complete set of commands to automate data preparation in R & SAS. • Work through some simplified examples to understand how they can be applied • Try to apply scripts to your own data • If you run into problems with your own data: let’s solve them together.
Recommend
More recommend