Dan Myers Thesis Defense July 17, 2018 Indian Mill Creek - PowerPoint PPT Presentation
Dan Myers Thesis Defense July 17, 2018 Indian Mill Creek Northwest side of Grand Rapids Agricultural headwaters Urbanized lower reaches Coldwater trout stream Impaired Altered hydrology and sedimentation (Sigdel
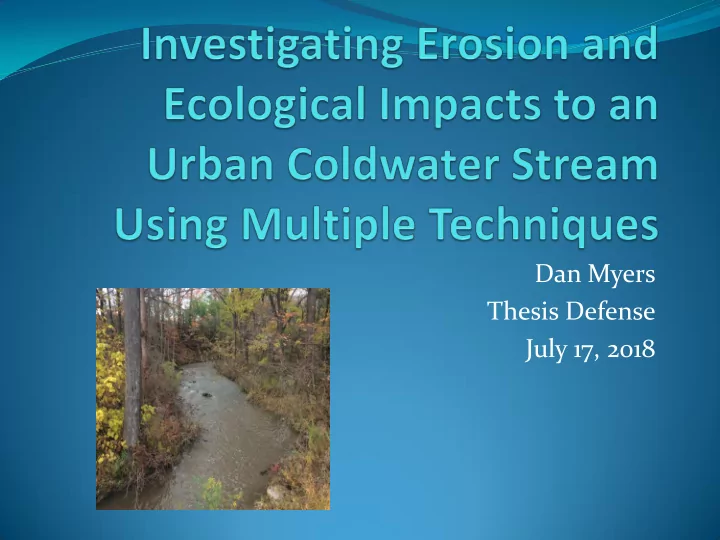
Dan Myers Thesis Defense July 17, 2018
Indian Mill Creek Northwest side of Grand Rapids Agricultural headwaters Urbanized lower reaches Coldwater trout stream Impaired Altered hydrology and sedimentation (Sigdel 2017)
Elevation Gradient
Upper Watershed (Agricultural)
Middle Watershed (Urban / Natural)
Lower Watershed (Urban)
Flashy Flows, Eroding Banks, and High Bedload Sediment Transport
Schematic diagram of factors leading to habitat loss in Indian Mill Creek (Source: Sigdel 2017)
Outline Synthesis Study #2: Intro and Watershed Conclusion Modeling Study #1: Study #3: Q & A Habitat, Streambank Fish, and Erosion Bugs
Study #1 “Impacts of an Agricultural/Urban Land Cover Gradient in a Coldwater Stream” DT Myers, RR Rediske, JN McNair, AD Parker, and EW Ogilvie
Objective and Hypothesis Objective: Assess stream habitat and biological community integrity across a gradient of agricultural and urban land cover. Hypothesis: Stream habitat and biological community structure are correlated with landscape, hydrologic, and geomorphic variables.
Methods Stream Habitat Survey Geomorphic units Streambed substrate Woody debris Riparian conditions
Methods • Sediment Monitoring
Methods Stream Temperature Loggers
Methods Macroinvertebrate and Fish Surveys Procedure 51 Multivariate Statistics
Streambed Substrate Results Median Particle Median Particle Site Size (mm) Type Lower Richmond Park 5-8 Fine Gravel Reaches Sharp Dr. (Lower) 33-64 Very Coarse Gravel Sharp Dr. (Upper) 17-32 Coarse Gravel Scout Pavilion 0.26 - 0.50 Medium Sand Five Mile Rd. 0.06 - 0.125 Very Fine Sand West Branch 0.26 - 0.50 Medium Sand Headwaters East Branch 0.126 - 0.25 Fine Sand Blandford Nature Center 0.26 - 0.50 Medium Sand Tributaries Walker Ditch <0.06 Silt / Clay
Sediment Loading Results Suspended load Bedload Site (kg day -1 ) (kg day -1 ) Lower Richmond Park 523 2,687 Reaches Sharp Dr. (Lower) 110 233 Sharp Dr. (Upper) 120 9 Scout Pavilion 110 112 Five Mile Rd. 36 61 Headwaters West Branch 7 31 Tributaries East Branch 16 33 Blandford Nature Center 5 86 Walker Ditch 1 13
Procedure 51 Fish Results Total Fish Community Site Score Rating Lower Turner Ave. -1 Poor (<50 fish) Reaches Richmond Park (Tamarack) -5 Poor (<50 fish) Richmond Park (Dam) -4 Poor (<50 fish) Sharp Dr. (Lower) -2 Poor (<50 fish) Sharp Dr. (Upper) -5 Poor Middle 3 Mile Road -4 Acceptable Reaches Scout Pavilion -8 Poor
Procedure 51 Macroinvertebrates Macroinvertebrate Site Total Score Rating Lower Richmond Park -4 Acceptable Reaches Sharp Dr. (Lower) -6 Poor Sharp Dr. (Upper) -2 Acceptable Scout Pavilion -4 Acceptable 5 Mile Rd. -6 Poor West Branch -8 Poor Headwaters East Branch -4 Acceptable Blandford Nature Center -3 Acceptable Tributaries Walker Ave. Ditch -5 Poor
Study #1 Major Findings Aquatic habitat, fish, and macroinvertebrate communities are degraded throughout the watershed Fine substrate in the streambed has the strongest association with degraded macroinvertebrate communities
Study #2 “Watershed and Streambank Erosion Modeling in a Michigan, USA Stream Using the GWLF-E Model and MapShed GIS Plugin” DT Myers, RR Rediske, JN McNair, and ME Allen
Objective and Hypothesis Objective: Spatially assess runoff, field erosion, and streambank erosion in the Indian Mill Creek watershed using a model. Hypothesis: Agricultural areas in the upper watershed contribute the most sediment from field erosion, urban areas in the lower watershed have the highest streambank erosion rates, and the model reliably estimates stream discharge.
GWLF-E Model (Evans et al. 2003) Enhanced Generalized Watershed Loading Functions Mid-complexity Validated with Pennsylvania watersheds Appropriate because we are more interested in spatial patterns than numerical targets Model runoff, sediment loading, and streambank erosion in 20 subbasins from 1997-2015
GWLF-E Model
GWLF-E Runoff
Flashy Flows by Outlet
Discharge Estimate Evaluation
GWLF-E Field Erosion
GWLF-E Streambank Erosion
Where Does the Sediment Go? Watershed degradation Habitat Fish Macroinvertebrates Out to the Grand River
Eroding Banks Throughout!
Study #2 Major Findings The GWLF-E model predicts high proportions of runoff in urban areas, like Brandywine Creek, and high field erosion rates with steep slopes and erodible soils. Streambank erosion is a major contributor to sediment loading in lower subbasins of Indian Mill Creek and more research is needed about it.
Study #3 “Measuring Streambank Erosion: A Comparison of Erosion Pins, Total Station, and Terrestrial Laser Scanner” DT Myers, RR Rediske, and JN McNair
Objective and Hypothesis Objective: Compare three techniques to measure bank erosion (erosion pins, total station, and laser scanner), then assess the spatial patterns and compare results with GWLF-E model. Hypothesis: The three techniques will provide significantly different estimates of streambank erosion due to their abilities to detect spatial differences. Also, measurements will be higher than GWLF-E predictions.
Study Design Nine sites 18 study banks Laser scans at 10 Variety of conditions Vegetation Erosion or deposition Measurements May 2017 to May 2018 Compared with statistical tests
Erosion Pins, Total Station, and Laser Scanner
Laser Scanning
Significance Testing Normal distribution Shapiro Wilk Tests ANOVA Random Block Design No detectable differences between technique df=2, f=0.457, p=0.639
Pearson Test for Correlations Erosion pins and total station [A] Not significant (R 2 =0.26, p=0.165) Erosion pins and laser scanner [B] Not significant (R 2 =0.16, p=0.289) Total station and laser scanner [C] Significant (R 2 =0.79, p=0.001) [A] [B] [C] 0.4 Laser Scanner (m^3 / m / yr) Laser Scanner (m^3 / m / yr) 0.03 0.03 Total Station (m^3 / m / yr) 0.2 0.01 0.01 0.0 -0.03 -0.01 -0.03 -0.01 -0.2 -0.10 0.00 0.05 -0.10 0.00 0.05 -0.2 0.0 0.2 0.4 Erosion Pins (m^3 / m / yr) Erosion Pins (m^3 / m / yr) Total Station (m^3 / m / yr)
Percent Difference Resop and Hession 2010 Erosion pins and total station 650% Laser scanner and erosion pins 596% Laser scanner and total station 1,275%
Comparison of Techniques at Sites
Average Laser Coverage of Bank No heavy vegetation 32.5% Heavy vegetation 11.75% Significantly different P = 0.047 Tree roots also cause data gaps
Laser Scan Coverage
Complex Banks
Bank Erosion in Watershed
East Branch (Headwaters) Streambed dominated by fine sand GWLF-E predicts low bank erosion Surveys show some of the highest bank erosion rates
Sharp Drive (Middle Reaches) High gradient Severe bank erosion Coarser substrate
Richmond Park (Near Outlet) GWLF-E predicts highest bank erosion Surveys show net deposition of sediment on banks Degraded fish community
Estimation of Sediment Loading GWLF-E estimate Field erosion = 5,078 Mg yr -1 Bank erosion = 1,031 Mg yr -1 Erosion pin estimate Bank erosion = 2,020 Mg yr -1 28% of total load
Study #3 Major Findings Differing results between techniques could be due to a combination of vegetation, undercut banks, and coverage; choice of technique is important. Streambank erosion is a major contributor to sediment loading which affects the quality of aquatic habitat, fish, and macroinvertebrate communities in the Indian Mill Creek watershed.
Land Cover Synthesis Change Increased Runoff and Sediment Loading Degraded Sediment Aquatic from Eroding Habitat Streambanks Impaired Fish and Macroinvertebrates
Management Recommendations Controlling runoff is most important! (Walsh et al. 2005) Restore creek to more natural timing and volume of flows Intense storm flows constrain aquatic communities
Controlling Runoff Urban low impact development Bioretention basins Pervious pavement Reduction in impervious surface area Agricultural conservation practice standards Riparian cover Filter strips Cover crops
Check Out Our Blog! Indianmillstudy.wordpress.com
Recommend


More recommend
Explore More Topics
Stay informed with curated content and fresh updates.