
Presented By: Dan Kitchen Utility Service Group
• Developed by the University of Bristol • 2010 Winner IWA Innovation Award: Global Grand Prize Winner
Why? • Asset management Cost reduction Preventative maintenance extends the useful life of pipes • Chemical demand Reduce chemicals needed to battle Hydrogen Sulfide Issues – in turn leads to less customer complaints • Pumping costs Can significantly increase flow or discharge rate
Why? • Reduce discolored water complaints • Improve water quality compliance • Reduce biofilm deposits • Reduce THM production • Remove iron and manganese build up
Se Sedim iment ents Associated ciated problems lems: Flow Odor Issues Customer complaints
Cleaning devices: Pigs Swabs Operational problems: • Incompatible with pipe bends and changes in diameter • Requires Excavation Excavate to launch and receive pigs • Customer service affected Long interruption to supply
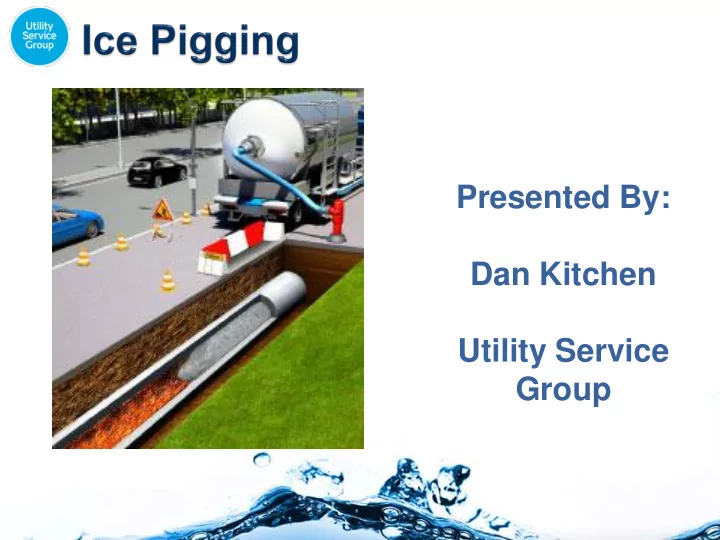
Wha hat t is is Ice ce Pi Pigg gging? ing? A patented innovative sustainable pipe cleaning technology to improve water quality and asset management
Ice Pigging harnesses the characteristics of a semi-solid material • An ice pig g is a semi-sol solid id materi rial al that t can be pumped ped like a liquid id • Bu But behaves aves like a solid once the pig g is formed d in the pipe
Detailed Site Visit • Obtain detailed plans from client • Length of Main, Diameter, Material, Access Points • Maps • Additional Water • Access? – Traffic management
Ice e Pig iggin ing in in Pra ractic ice: Custom built equipment
Custom built equipment
Make the ice
Ice Pigging – The Equipment Flow Analysis System
Ice Pigging WW Force Main Improves Pumping Efficiency 4” Force Main Pre and post pump test results: Date Pump 1 Pump 2 10/1/2012 257 gpm 256 gpm 1/14/2013 334 gpm 325 gpm 29.9% increase 25.9% increase . Dallastown Borough, PA
By cleaning the force main and improving flows over 29% , the Borough can postpone the capital improvement project, allowing that money to be used more effectively.
Ice Pigging WW Force Main Improves Pumping Efficiency • Original plant design flow rate was 6.2 mgd. • Decrease in flow rates – Industrial discharge included Cabot Cheese and several breweries. • 10/4/13 flow rate was 5.62 mgd (3,904 gpm). • 10/7- 10/28/13 conducted 9 IP runs on 12,000 of 16” & 18” DIP and PVC mains. Middlebury Wastewater, VT
Pre and post pump test results: ◦ Date Two Pumps Flow Rates ◦ 10/4/2013 5.62 mgd (3,904 gpm) ◦ 10/28/2013 6.26 mgd (4,347 gpm) ◦ 11% increase (640,000 gpd or 444 gpm) By cleaning the force main, flow rates increased to 6.26 mgd (4,347 gpm) for an approximate 11% increase in flow. Back to Original Design Capacity
January 2013 Underground Construction
August 2012 & March 2013 Opflow
Conta tact ct Inform rmatio tion: Every Drop Along The Way... Dan Kit itchen (269) 377-0771 0771 dkit itchen hen@uti @utili lityser tyservice vice.c .com om
Recommend
More recommend