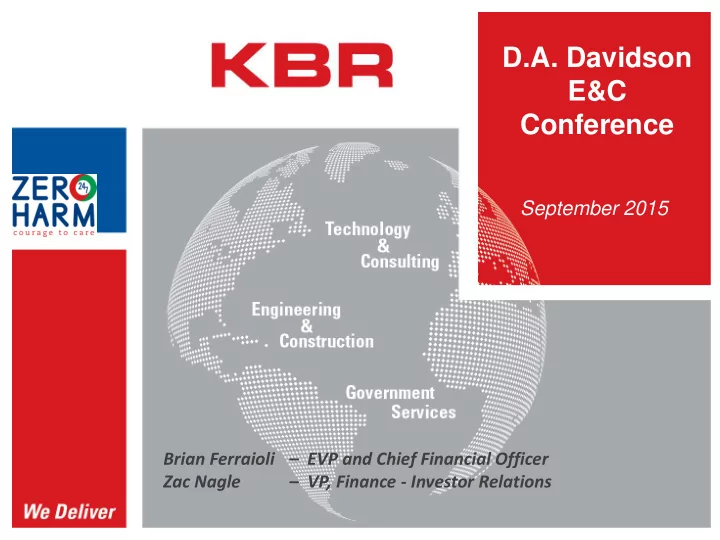
D.A. Davidson E&C Conference September 2015 Brian Ferraioli - PowerPoint PPT Presentation
D.A. Davidson E&C Conference September 2015 Brian Ferraioli EVP and Chief Financial Officer Zac Nagle VP, Finance - Investor Relations Forward-Looking Statements This presentation contains forward - looking statements within
D.A. Davidson E&C Conference September 2015 Brian Ferraioli – EVP and Chief Financial Officer Zac Nagle – VP, Finance - Investor Relations
Forward-Looking Statements This presentation contains “forward - looking statements” within the meaning of Section 27A of the Securities Act of 1933 and Sect ion 21E of the Securities Exchange Act of 1934. These forward-looking statements include statements regarding our plans, objectives, goals, strategies, future events, future financial performance and backlog information and other information that is not historical information. When used in this presentation, the words “estimates,” “expects,” “anticipates,” “projects,” “plans,” “intends,” “believes,” “forecasts” or future or conditional verbs su ch as “will,” “should,” “could,” or “may,” and variations of such words or similar expressions are intended to identify forward -looking statements. All forward-looking statements are based upon our current expectations and various assumptions. Our expectations, beliefs, and projections are expressed in good faith, and we believe there is a reasonable basis for them. However, there can be no assurance that management’s expectations, beliefs, and projections will be achieved. There are numerous risks and uncertainties, many of which are beyond our control, that could cause actual results to differ materially from the forward- looking statements contained in this presentation. These risks and uncertainties include, but are not limited to: current or future economic conditions; our ability to obtain and perform under contracts from existing and new customers, including the U.S. Government; exposure to cost overruns, operating cost inflation and potential liability claims and contract disputes; access to trained engineers and other skilled workers; risks relating to operating through joint ventures and partnerships; risks inherent in doing business internationally; potential tax liabilities; maritime risks; changes in the demand for our services and increased competition; protection of intellectual property rights; risks associated with possible future acquisitions; risks related to our information technology systems; impairment of goodwill and/or intangible assets; reduction or reversal of previously recorded revenues; risks relating to audits and investigations, including by governments; compliance with laws and regulations, and changes thereto, including those relating to the environment, trade, exports and bribery; our creditworthiness and ability to comply with the financial covenants in our credit agreement; and other risk factors discussed in our most recently filed Form 10-K, any subsequent Form 10-Qs and 8-Ks, and other Securities and Exchange Commission filings. All forward-looking statements attributable to us, or persons acting on our behalf, apply only as of the date made and are expressly qualified in their entirety by the cautionary statements in this presentation. Except as required by law, we undertake no obligation to revise or update forward-looking statements to reflect events or circumstances that arise after the date made or to reflect the occurrence of unanticipated events. This presentation contains the financial measure “EBITDA,” which is not calculated in accordance with generally accepted acco unting principles in the U.S. (“GAAP”). A reconciliation of the non-GAAP financial measure EBITDA to the most directly comparable GAAP financial measure has been provided in the Appendix to this presentation. 2
KBR’s Zero Harm 24/7 5-Year TRIR Performance 0.45 0.4 0.39 0.39 0.37 0.35 0.35 0.35 0.35 0.31 0.34 0.32 0.3 0.30 0.26 0.25 0.23 0.22 0.21 0.2 0.19 0.18 0.15 0.1 0.05 KBR TRIR IOGP Top Q IOGP Average 0 2010 2011 2012 2013 2014 2015 3
Agenda • Introduction • Overview & Strategy • Market Outlook • Financial Results • Q&A 4
KBR Overview • KBR, Inc. is a global technology, engineering, procurement and construction company serving the hydrocarbons and government services industries. • More than 100 year proud history. • #424 in Fortune 500 rankings. • 25,000 employees in more than 45 countries. • Customers in more than 70 countries. 5
Structure – Streamlined / Focused Old KBR operating segment structure (16 business units) KBR Infrastructure, Gas Hydrocarbons Government & Services Operations Monetization Power New streamlined operating segment structure (5 business units) KBR Engineering & Government Technology & Consulting Construction Services 6
KBR’s Business Groups Technology & Consulting Engineering & Construction Government Services Proprietary Technologies Offshore EMEA Upstream Fixed Platforms Home Base Operational • Semi-submersible hull Support Floating Facilities Overseas Operational Support design Hulls, Moorings & Risers • Monohull vessels Programme Management SURF Services Downstream LNG / GTL Resilience Planning & • Refining Liquefaction Execution • Olefins Regasification Training • Ammonia FLNG APAC • Chemicals FSRU Asset Management • Coal Gasification Onshore Systems Engineering Consulting and Services Oil & Gas Integrated Logistics Support Upstream Refining Capability Risk Management • Field development Petrochemicals Training planning Chemicals Americas • Project assurance Ammonia & Fertilizers International Base Operations • Integrity management Gasification Support • Structural analysis Asset Services Remote Life Support Services Downstream Maintenance Logistics • Downstream consulting Modifications • Feasibility and revamp Small Capex Projects studies Asset Integrity • Technical services • Automation consulting and project management 7
KBR Global Operations Moscow Gothenburg Atyrau Edmonton London Seoul Beijing Baku Kabul Wilmington Tokyo Baghdad Delhi Arlington Houston Bahrain Shanghai Birmingham Kuala Lumpur Monterrey Caracas Saudi Arabia Dubai Mexico City Singapore Pune Freetown Chennai Jakarta Luanda Rio de Janeiro Perth Sydney Canberra Melbourne 25,000 Employees in more than 45 Countries Customers in more than 70 Countries 8
Leadership Team Stuart Bradie President and CEO E&C Group President 27 Years of Industry Experience Brian Ferraioli John Derbyshire Andrew Pringle Engineering & Construction Engineering & Construction CFO Technology & Consulting Government Services 37 Years of Industry 37 Years of Industry 14 Years of Industry Experience Experience Experience (37 Years Military Experience) Roy Oelking Jan Egil Braendeland Ivor Harrington E&C Americas E&C EMEA E&C APAC 40 Years of Industry 22 Years of Industry 30 Years of Industry Experience Experience Experience David Zelinski Jay Ibrahim Graham Hill E&C Americas (Onshore) E&C MENA Global Sales & Strategy 30 Years of Industry 21 Years of Industry 37 Years of Industry Experience Experience Experience Farhan Mujib Eileen Akerson Nick Anagnostou Commercial Legal HSSE 19 Years of Industry 27 Years of Industry 25 Years of Industry Experience Experience Experience 9
Strategic Priorities Early project involvement Priority Markets via differentiated technology Global Hydrocarbons (Gas) & (gas monetization) & International Government specialized consultancy Services services 2 1 Re-focus Growth Strategy 3 4 Pursue Fixed Price EPC when differentiated by: - KBR Technology Global project delivery focus - Related experience organized with regional - Ability to self-perform accountability construction (predominantly gas monetization) 10
Framework to Support Core Focus One KBR: Exit non-strategic businesses: Consistent use & application of - Stand-alone Fixed Price EPC Power standard policies, processes, systems, - Fixed Price U.S. Infrastructure & tools & procedures to deliver U.S. Minerals - Building Group consistency and efficiency 2 1 - Fixed Priced Stand-alone Construction Streamline Operations 3 4 Efficiencies: Allocate capital Be cost competitive; in an efficient $200 million reduction in annual and balanced operating costs by 2016; > $125 million manner in savings already identified / actioned Note: All statements current as of KBR’s 2 Q15 earnings call on 08/04/2015 11
Recommend

![A New Approach to Treat the RANS-LES interface in PANS [1] Lars Davidson Lars Davidson,](https://c.sambuz.com/896511/a-new-approach-to-treat-the-rans-les-interface-in-pans-1-s.webp)


More recommend
Explore More Topics
Stay informed with curated content and fresh updates.