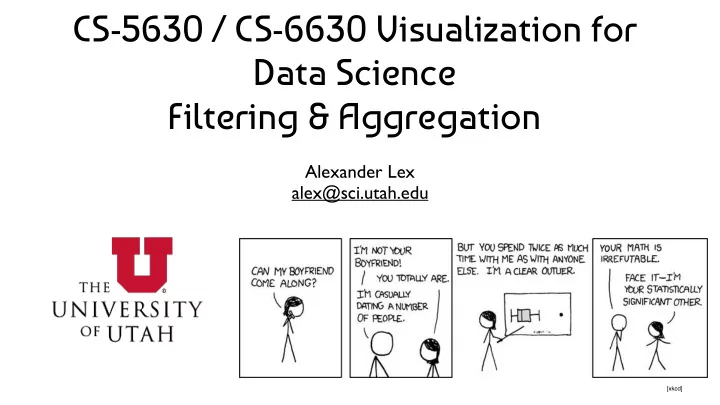

CS-5630 / CS-6630 Visualization for Data Science Filtering & Aggregation Alexander Lex alex@sci.utah.edu [xkcd]
Filter elements are eliminated What drives filters? Any possible function that partitions a dataset into two sets Bigger/smaller than x Fold-change Noisy/insignificant
Dynamic Queries / Filters coupling between encoding and interaction so that user can immediately see the results of an action Queries: start with 0, add in elements Filters: start with all, remove elements Approach depends on dataset size
ITEM FILTERING Ahlberg 1994
NONSPATIAL FILTERING
Scented Widgets information scent: user’s (imperfect) perception of data GOAL: lower the cost of information foraging through better cues Willett 2007
Interactive Legends Controls combining the visual representation of static legends with interaction mechanisms of widgets Define and control visual display together Riche 2010
Aggregation
Aggregate a group of elements is represented by a (typically smaller) number of derived elements
Histograms Explained http://tinlizzie.org/histograms/
Histogram # passengers Good #bins hard to predict make interactive! rules of thumb: age 10 Bins #bins = sqrt(n) # passengers #bins = log2(n) + 1 age 20 Bins
Unequal Bin Width Can be useful if data is much sparser in some areas than others Show density as area, not hight. https://www.nytimes.com/interactive/2015/02/17/upshot/what-do-people-actually-order-at-chipotle.html?_r=1
Density Plots http://web.stanford.edu/~mwaskom/software/seaborn/tutorial/plotting_distributions.html
Box Plots aka Box-and-Whisker Plot Show outliers as points! Not so great for non-normal distributed data Especially bad for bi- or multi- modal distributions Wikipedia
One Boxplot, Four Distributions http://stat.mq.edu.au/wp-content/uploads/2014/05/Can_the_Box_Plot_be_Improved.pdf
Notched Box Plots Notch shows m +/- 1.5i x IQR/sqrt(n) -> 95% Confidence Intervall A guide to statistical significance. Kryzwinski & Altman, PoS, Nature Methods, 2014
Box(and Whisker) Plots http://xkcd.com/539/
Comparison Streit & Gehlenborg, PoV, Nature Methods, 2014
Bar Charts vs Dot Plots Data Source https://bmcneurosci.biomedcentral.com/articles/10.1186/1471-2202-10-67 https://twitter.com/robustgar/status/859318971920769024
Violin Plot = Box Plot + Probability Density Function http://web.stanford.edu/~mwaskom/software/seaborn/tutorial/plotting_distributions.html
Showing Expected Values & Uncertainty NOT a distribution! Error Bars Considered Harmful: Exploring Alternate Encodings for Mean and Error Michael Correll, and Michael Gleicher
Heat Maps binning of scatterplots instead of drawing every point, calculate grid and intensities 2D Density Plots
Continuous Scatterplot Bachthaler 2008
Spatial Aggregation
Spatial Aggregation modifiable areal unit problem in cartography, changing the boundaries of the regions used to analyze data can yield dramatically different results
A real district in Pennsylvania Democrats won 51% of the vote but only 5 out of 18 house seats
Valid till 2002 http://www.sltrib.com/opinion/ 1794525-155/lake-salt-republican- county-http-utah 29
2016 Congressional Elections https://www.dailykos.com/stories/2016/12/29/1611906/-Here-s-what-Utah-might-have-looked-like-in-2016-without-congressional-gerrymandering
Voronoi Diagrams Given a set of locations, for which area is a location n closest? D3 Voronoi Layout: https://github.com/d3/d3-voronoi
Voronoi Examples
Voronoi for Interaction Useful for interaction: Increase size of target area to click/hover Instead of clicking on point, hover in its region https://github.com/d3/d3-voronoi/
Constructing a Voronoi Diagram Calculate a Delauney triangulation Triangulation where no vertices are in a circle described by the vertices of a triangle Voronoi edges are perpendicular to triangle edges. https://en.wikipedia.org/wiki/Delaunay_triangulation http://paulbourke.net/papers/triangulate/
Design Critique
https://goo.gl/IDRXDl http://mariandoerk.de/edgemaps/demo/
Clustering
Clustering Classification of items into “similar” Hierarchical Algorithms bins Produce “similarity tree” – Based on similarity measures dendrogram Euclidean distance, Pearson Bi-Clustering correlation, ... Clusters dimensions & records Partitional Algorithms Fuzzy clustering divide data into set of bins # bins either manually set (e.g., k- allows occurrence of elements means) or automatically determined in multiples clusters (e.g., affinity propagation)
Clustering Applications Clusters can be used to order (pixel based techniques) brush (geometric techniques) aggregate Aggregation cluster more homogeneous than whole dataset statistical measures, distributions, etc. more meaningful
Clustered Heat Map
Cluster Comparison
Aggregation TYLER JONES TYLER JONES
Example: K-Means Goal: Minimize aggregate intra-custer distance ( inertia ) total squared distance from point to center of its cluster for euclidian distance: this is the variance measure of how internally coherent clusters are
Lloyd’s Algorithm Input: set of records x 1 … x n , and k (nr clusters) Pick k starting points as centroids c 1 … c k While not converged: 1. for each point x i find closest centroid c j • for every c j calculate distance D( x i , c j ) • assign x i to cluster j defined by smallest distance 2. for each cluster j , compute a new centroid c j by calculating the average of all x i assigned to cluster j Repeat until convergence, e.g., no point has changed cluster distance between old and new centroid below threshold number of max iterations reached
1. Initialization 2. Assign Clusters 4. Assign Clusters 3. Update Centroids And repeat until converges
Illustrated https://www.naftaliharris.com/blog/visualizing-k-means-clustering/
Choosing K
Properties Lloyds algorithm doesn’t find a global optimum Instead it finds a local optimum It is very fast: common to run multiple times and pick the solution with the minimum inertia
K-Means Properties Assumptions about data: roughly “circular” clusters of equal size http://stats.stackexchange.com/questions/133656/how-to-understand-the-drawbacks-of-k-means
K-Means Unequal Cluster Size http://stats.stackexchange.com/questions/133656/how-to-understand-the-drawbacks-of-k-means
Hierarchical Clustering Two types: agglomerative clustering start with each node as a cluster and merge divisive clustering start with one cluster, and split
Agglomerative Clustering Idea A C D E B F C D E F A B
Linkage Criteria How do you define similarity between two clusters to be merged (A and B)? • maximum linkage distance: two elements that are apart the furthest • use minimum linkage distance: the two closest elements • use average linkage distance • use centroid distance
F+C Approach, with Dendrograms [Lex, PacificVis 2010]
Hierarchical Parallel Coordinates Fua 1999
Dimensionality Reduction
Dimensionality Reduction Reduce high dimensional to lower dimensional space Preserve as much of variation as possible Plot lower dimensional space Principal Component Analysis (PCA) linear mapping, by order of variance
PCA
PCA Example – Class Project 2013 http://mu-8.com/ [Mercer & Pandian]
Multidimensional Scaling Nonlinear, better suited for some DS Multiple approaches Works based on projecting a similarity matrix How do you compute similarity? How do you project the points? Popular for text analysis [Doerk 2011]
Can we Trust Dimensionality Reduction? Topical distances between departments in Topical distances between the selected a 2D projection Petroleum Engineering and the others. [Chuang et al., 2012] http://www-nlp.stanford.edu/projects/dissertations/browser.html
Probing Projections http://julianstahnke.com/probing-projections/
MDS for Temporal Data: TimeCurves http://aviz.fr/~bbach/timecurves/
Recommend
More recommend