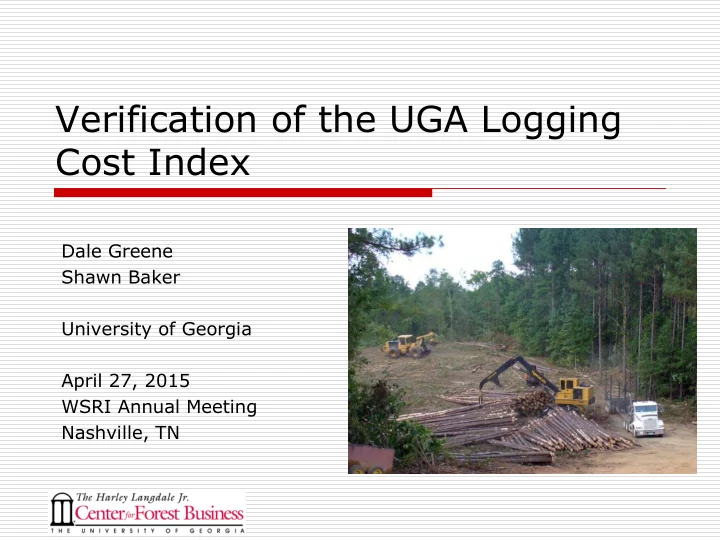

Verification of the UGA Logging Cost Index Dale Greene Shawn Baker University of Georgia April 27, 2015 WSRI Annual Meeting Nashville, TN
Background In 2012, we interviewed southern loggers to develop a logging cost index. No recent data on the composition of the logging industry across the South – only occasional state surveys. Need to assess accuracy of the index and representativeness of our logger sample.
Interview Results – 2012 23 contractors (July – Sept.), 19 shared cost data Companies averaged 21 employees with 12 in the woods All contractors used feller- buncher/skidder/knuckleboom systems 45% of hauling was contracted
UGA Logging Cost Index – 2013 start Developed an index of cut & load cost/ton No hauling cost included Initial value was 4Q 2011 Reported quarterly in Timber Mart-South since 1Q 2013 Replaces the index reported by Stuart & Grace annually
UGA Logging Cost Index $14 Logging Cost Index $12 $10 Stuart Index $8 UGA Logging Cost Index $6
Research Objectives Determine the characteristics of loggers in each region of the country. Assess the accuracy of online survey methods for logging contractors. Validate the UGA Logging Cost Index with contractor cost data.
Online Survey Information Rapid survey (less than 20 questions) Basic business details Employees, production, crews, harvest systems, etc. Years in business, owner age This provides a basis for comparison between regions Also solicit participants willing to be interviewed and share cost data to support & validate the cost index
Results – Disappointing We had 42 responses nationwide, 23 completed, 13 volunteered for interviews. No responses from West region.
Regional Breakdown Region Responses Lake States 3 Northeast 5 South 20 West 1 Poor response in all regions Loggers in 12 states No more than six from one state (VA)
Online Survey Conclusions The logging industry is not ready for a purely web-based survey Asking magazine readers to type web address was unsuccessful Direct email of weblink also brought little response Inadequate response to determine the representativeness of the logging cost index sample
Index Validation Initial interviews provided data for only one year (2011) The UGA Logging Cost Index was matched to historical trends from the Stuart index to determine its accuracy UGA Logging Cost Index has covered the last three years Can compare the calculated index values against actual cost records of contractors from 2012 and 2013
Methods Gathered business information and cost data through on-site interviews with logging contractors Correction was needed to account for annual production variation The UGA Logging Cost Index is not adjusted for production, considering only changes in input costs
Participant Sample We interviewed 23 of 47 contractors contacted for participation Only 10 of the participants had participated in the initial study, 13 declined 17 participants shared cost data for 2013 and 14 shared for 2012 as well The 17 contractors sharing cost data harvested 3,000,000 tons in 2013 Median production was 3,600 tons per week Companies averaged 2.6 crews and 18 employees with 10 in the woods
Cost Components $12.34 $12.13 $12.17 $14.00 Average Cut & Load Cost ($/Ton) $12.00 $0.67 $0.72 $0.75 Insurance $0.57 $0.65 $0.63 $10.00 Administrative $2.64 $3.11 $3.03 Fuel $8.00 $1.70 Repair and Maintenance $1.59 $1.68 $0.18 $0.19 $6.00 Interest Expense $0.14 $2.31 $1.85 $1.86 Depreciation $4.00 Labor $4.25 $4.01 $4.09 $2.00 $- 2011 2012 2013
Reported Costs and UGA LCI $14.50 $14.00 $13.50 $13.00 $12.50 $12.00 UGA LCI $11.50 Actual Costs $11.00 $10.50 $10.00 4Q 1Q 2Q 3Q 4Q 1Q 2Q 3Q 4Q 1Q 2Q 3Q 4Q 2011 2012 2012 2012 2012 2013 2013 2013 2013 2014 2014 2014 2014
Correcting for Varying Production Contractors $12.75 providing data all $12.50 three years (N=6) $12.25 Corrected for $12.00 production and $11.75 compared on annual $11.50 basis $11.25 Nearly identical $11.00 Actual Costs change in cost $10.75 UGA LCI $10.50 2011 2012 2013
Accuracy of Cost Estimation 40% Predicted Change from UGA Logging 30% 20% Outlier Cost Index 10% 0% -40% -20% 0% 20% 40% -10% -20% -30% -40% Actual Change in Per Ton Costs Average deviation is 0.1% (± 3.9%)
Logging Costs and Diesel $13.50 $5.00 UGA Logging Cost Index $4.50 Diesel Price ($/Gal) $13.25 $4.00 $3.50 $13.00 $3.00 $12.75 $2.50 $2.00 UGA LCI $12.50 $1.50 Diesel Price $1.00 $12.25 $0.50 $12.00 $-
Increasing Investment 40 No. of Logging Machines 35 30 25 20 15 10 5 0 2012 Survey 2014 Survey
Logging Cost Summary The UGA Logging Cost Index appears to be reasonably accurate measure of input cost changes Production variability is still a major driver of cost changes for individual businesses Additional long-term verification is needed to assess the production-neutral assumption and track individual component costs against the public indicator data
May 2014 – Journal of Forestry
Quarterly Reporting in Timber Mart South
Technical Transfer Southcentral FRA meeting, March MeadWestvaco Logger Training, June 5 Council on Forest Engineering, June 25 Louisiana Forestry Assn, August Appalachian FRA, Sept. 18 Southeastern SAF, Oct. 21 Journal article ready for submission to Journal of Forestry
Questions Thank you for your continued support!
Recommend
More recommend