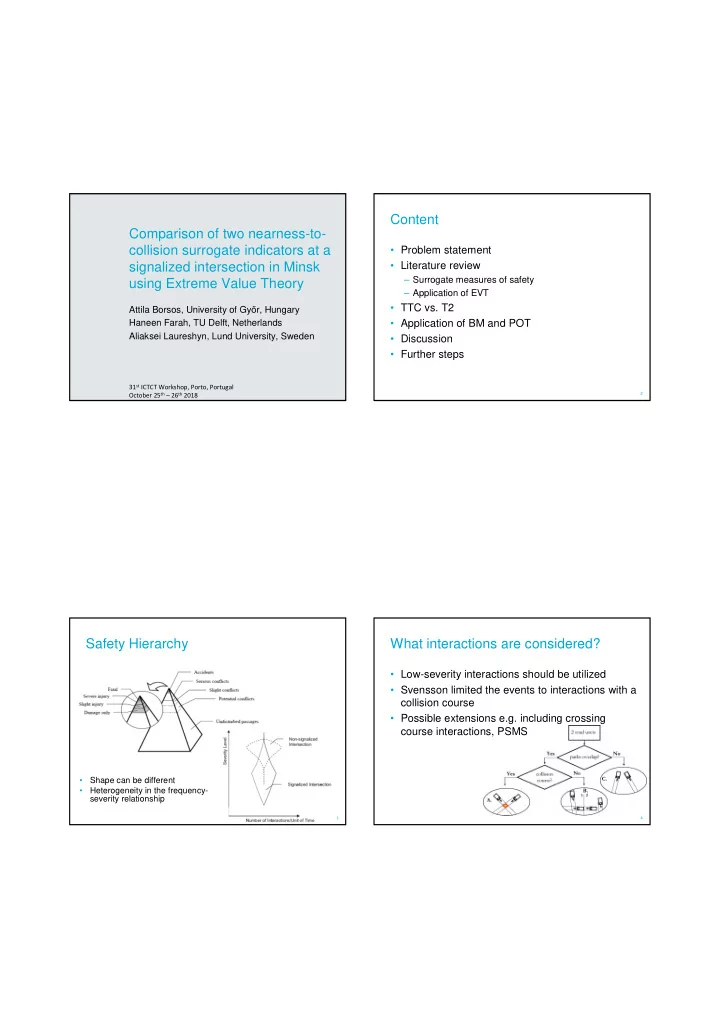

Content Comparison of two nearness-to- collision surrogate indicators at a • Problem statement signalized intersection in Minsk • Literature review – Surrogate measures of safety using Extreme Value Theory – Application of EVT • TTC vs. T2 Attila Borsos, University of Gy ő r, Hungary Haneen Farah, TU Delft, Netherlands • Application of BM and POT Aliaksei Laureshyn, Lund University, Sweden • Discussion • Further steps 31 st ICTCT Workshop, Porto, Portugal October 25 th – 26 th 2018 2 Safety Hierarchy What interactions are considered? • Low-severity interactions should be utilized • Svensson limited the events to interactions with a collision course • Possible extensions e.g. including crossing course interactions, PSMS • Shape can be different • Heterogeneity in the frequency- severity relationship 3 4
TTC vs. T2 Example in T-Analyst • Time until a collision • Time needed for the 2nd road user to arrive • Assumes unchanged at conflict point speed and trajectory • Based on planned • Acceleration/deceleration paths, and current not taken into account speeds • Requires a collision • Calculated for crossing course course interactions, as • Ignores many potential well conflicts • Continuous (min value) • Continuous (min value) 5 6 Example in T-Analyst EVT and SMS • First study by Tarko (2006) • Studies applied BM and/or POT • Contradicting results on which one is better • Mostly used TTC and PET TTCmin = 2.16 s (collision course) No collision course (No TTC value) • Mostly univariate, just a few bivariate (TTC&Speed, TTC&Time headway) • Linking EVT with accident data T2min = 1.76 s (crossing course) PET= 3.3 s (first vehicle leaves conflict p.) 7 8
Research gap/question Case • Comparison of surrogate indicators using EVT • Two-phase signalized intersection in Minsk • Esp. collision course vs. crossing course • 32 PDO crashes (5 straight-left turn) 1999-2009 • Recordings for 3 days (6AM – 9PM) • What can we learn from applying EVT using • 2749 interactions indicators describing collision course and • 1616 - subset of straight – left turning crossing course interactions at signalized • Subsets for indicators intersections for vehicle-vehicle interactions? – TTC: n=194 – T2: n=792 9 10 Extreme Value Theory Block Maxima Block maxima Peak over Threshold (GEV) (GPD) Generalized Extreme Value (GEV) distribution, where location parameter ( � ), scale parameter ( � ), shape parameter ( � ) 3 cases: •If � > 0, Fréchet distribution, heavy right tail and the right endpoint is infinite; •if � < 0, Weibull distribution, which has a finite endpoint ( � - � / � ); •if � =0, Gumbel distribution, light right tail 11 12
Peak over Threshold Block Maxima (results) • Minima (negated values), block=interaction • Selection of near-crashes – ”sub sampling of maxima” • threshold ( u ) excesses have a Generalized Pareto • But what is a near-crash? Distribution (GPD) with two parameters, the shape � and • Steps: the scale � parameters • similar to BM the shape parameter � determines the – 3.5 s as an initial value for both TTC and T2 behavior of the GPD – Several threshold values tested 13 14 Block Maxima (<3.5s) Block Maxima (different thresholds) • 3.5s → 5s (see plot) • 3.5s → 2s (see plot) • TTC (n=31) • T2 (n=443) • TTC (n=31 → 100) • T2 (n=443 → 130) • � = 1.0987 (Fréchet) • � = -0.1294 (Weibull) • � = 1.0987 → 0.0873 • � = -0.1294 → 0.1664 (Fréchet → Gumbel) (Weibull → Gumbel) • Pr(TTC=0)= 0.0733 (!) • Pr(T2=0)=0.0016 • Pr(TTC=0) 0.0733 → • Pr(T2=0)=0.0016 → 0.0040 (return periods 14 0.0098 (return periods → 247) 596 → 101) 15 16
Peak over Threshold (results) Peak over Threshold (results) (TTC<4s, T2<2s) • What threshold should we use? • Pr(TTC=0) = 0.00017 • Pr(T2=0) = 0.00055 (return period 5,884) (return period 1,807) 17 18 Summary of results Discussion • POT seems to give more reasonable results • Sample size issues with TTC (also because of the type of interaction itself) • Model fits for T2 are more reliable • Trade-off between a good model fit and reasonable threshold values • Motion prediction • How to validate? 19 20
Further steps • Bivariate models using e.g. speed, extended Thank you! Delta-V • Using EVT to differentiate severity levels 21
Recommend
More recommend