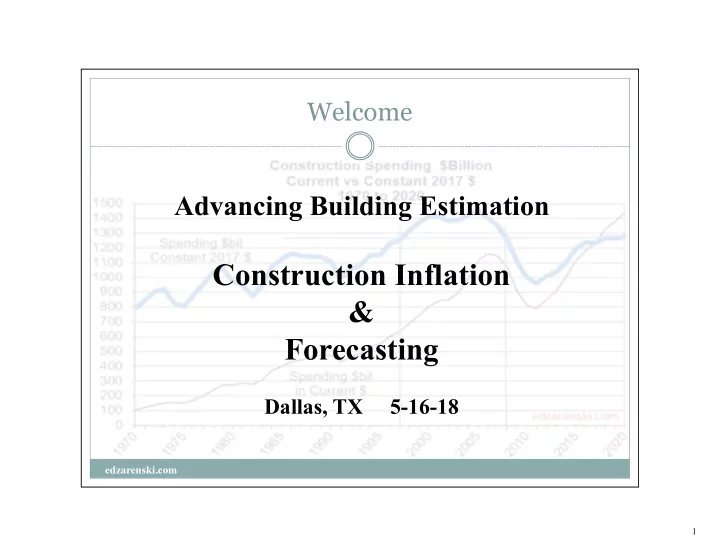

Welcome Advancing Building Estimation Construction Inflation & Forecasting Dallas, TX 5-16-18 edzarenski.com 1
Causes of Inflation Labor Availability / Wage Rate Material Availability and Demand Productivity Spending / Work Volume Level of Spending can have as much or more impact on inflation than labor & mtrl edzarenski.com 2
Project Inflation Impact Labor = 30% to 40% of project Increase 3% adds 0.9% to 1.2% inflation Material = 40% to 50% of project Increase 3% adds 1.2% to 1.5% inflation Margins = applied to 100% of project Increase 3% adds 3% to inflation edzarenski.com 3
Project Inflation Impact Project Inflation Impact a +10% increase in cost of material = on total cost of building • +0.06% Gypsum Board • +o.40% Concrete • +0.60% All Steel edzarenski.com 4
Project Inflation Impact Project Cost Inflation – Steel Tariff • +25% tariff on mill steel • mill steel is ¼ of Str Stl total cost • Str Stl is 10% of building cost • Other steel is 6% of building cost • 25% tariff = 1% of building cost • could be 5% of steel bridge cost edzarenski.com 5
Types of Inflation Indices TRADE SUB CM/GC/OWNER Inputs Outputs Labor & Material Selling Price PPI Materials Final Cost Market Basket PPI Trade Cost PPI Building Type Market Sector edzarenski.com 6
Construction Inflation Indices edzarenski.com 7
Final Cost Indices NONRESIDENTIAL BUILDINGS Construction Analytics Building Cost Index Turner Cost Index Rider Levett Bucknall Actual Cost Index INFRASTRUCTURE I H S Power Plant, Pipeline, Refinery Costs National Highway Construction Cost Index Bureau of Reclamation Construction Cost Trends RESIDENTIAL U S Census Constant Quality Single Family House edzarenski.com 8
Project Inflation Impact More than anything else REMEMBER Know what is included in an Index and Use the right Index for your project edzarenski.com 9
Construction Inflation Indices edzarenski.com 10
Construction Inflation Indices edzarenski.com 11
Inflation vs Spending/Volume edzarenski.com 12
Forecasting Overview Labor - wages, availability and productivity Material cost and availability Inflation Project Cost DMI / ABI / Starts Starts & Backlog Cashflow Market Sector Activity edzarenski.com 13
Sources of Forecasting Data Starting Backlog + New Starts creates Cash Flow Nonres Bldgs Spending 70%-75 from Starting Backlog Residential Spending 70% from New Starts Cash Flow = Spending = Revenue edzarenski.com 14
Forecasting – Market Sector Activity edzarenski.com 15
Forecasting Perspective Project Objective Resources / Schedule Inflation Budget / Cost Corporate Objective Market Share Growth = Volume Revenue minus Inflation = Volume Size = Volume = Staff edzarenski.com 16
Forecasting Future Outlook Common Oversights in Forecasting Misusing Starts/Backlog Data Not Adjusting History for Inflation Not Using Appropriate Indices Ignoring Productivity Considering Revenue = Volume Staffing to meet Revenue edzarenski.com 17
Forecasting Data edzarenski.com 18
Sources of Forecasting Data Current $ Spending = Revenue Current $ Spending is not adjusted for inflation Constant $ Spending = Volume Constant $ Spending = adjusted for inflation Volume dictates Staffing Needs edzarenski.com 19
Forecasting Data – Jobs All edzarenski.com 20
Forecasting Data – Jobs Nonres edzarenski.com 21
Forecasting Data – Jobs Rsdn edzarenski.com 22
Now You Know THE DIFFERENCES Inputs / Selling Price General Index / Market Sector Index Starts / Cash Flow / Spending Revenue / Volume edzarenski.com 23
Thank You Ed Zarenski Construction Analytics edzarenski@gmail.com @EdZarenski edzarenski.com edzarenski.com 24
Recommend
More recommend