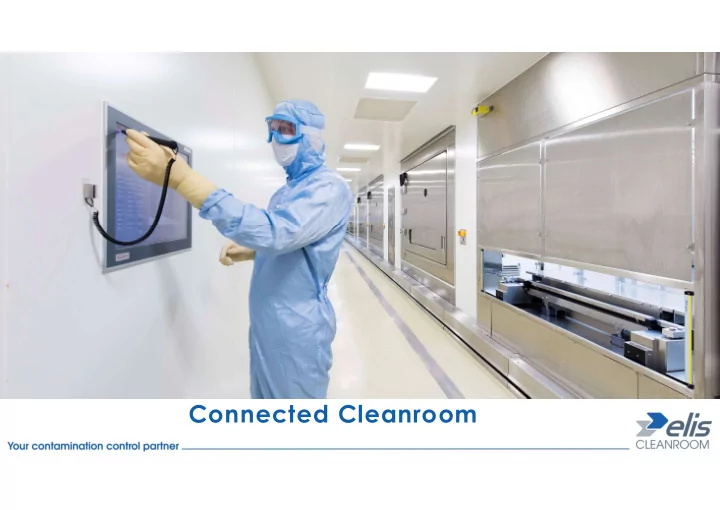

Connected Cleanroom 1
ELIS Cleanroom Different name More knowledge Even better service Improved contingency 2
3
About ELIS Cleanroom 19 Countries 28 Centers Oslo ~ 900 Employees Nyköping ~3,000 Customers Moscow Holbæk Kaluga Birr Bolsward Poznan Berlin Cork Newbury > €130mio Revenue Brussel Brno Pont-l’Evêque Bad Windsheim Velké Pavlovice Paris Saverne Budapest Bienne Lyon Milano Grenoble Toulouse Aix-en-Provence Barcelona São Paolo Madrid 4
Our Strategy “Customer dedicated“ Plants adding value Innovative Product & Service Offerings Jon, graag jou key messages End-to-End Contamination Control with UHF applications Specialized Consultants & Customer Focused Marketing Service Reliability Contingency without Total cost-in-use Superior Lab Testing, Glocal Key Account & Support on-site Contamination Control Optimisation Validation / Certification Approach compromises 5 5
Employees are the biggest polluters Additional needs Individual requirements • General training • Clean • Specific training • Reliable * technical • Precise * microbiological • Enthusiastic * product knowledge • No-problem attitude • Monitoring skills • Etc. • Evaluate skills • Etc. • Retraining 6
Digitalization & Internet of Things Internet of Things • UHF • Beacons • Indoor positioning systems • Sensors • Ultra wideband Digitalization • Smartphones and tablets • Web and mobile applications • Paperless reports and improved processes 7
Evolution in the cleanroom industry Improvement Process Development Internationalization of products & Improvement via Training of Standards & technologies data usage and/or Operators regulations semi-robots Current status Cleanroom Industry 8
Data observations FDA 2016 400 Data Intelligence can 344 contribute to 350 improvement! 300 250 202 200 147 150 118 100 78 76 44 50 0 Lack of or inadequate procedures Deficient Sanitization Monitoring Procedures are not followed Deficient Cleaning/Sanitizing of equipments Deficient Enviromental Monitoring Systems Deficient Calibration/Inspection of equipments Lack of training * https://www.fda.gov/ICECI/EnforcementActions/ucm531890.htm 9
Conclusions observations Cleanroom production companies are facing challenges to control / monitor behavior Market and regulated bodies desire contamination control of our products and people Key Question: 1. How can we optimize and/or maximize behavioral control and thus contamination control? 10
Action 1. QA develops the correct behavior procedures according to the needs by registering them adequately into a system (manually) 2. Monitor if the procedures are consequently been executed in the correct manner (automatization) What we have registered into a system (1) can be monitored by adequate data from the execution (2). Outcome: Execution overlaps procedures • Contamination Control optimization + data transfer = • Evidence based documentation 11
12
Full control by Track & Traceability Which different techniques are available? Manual registration • Barcode registration • LF chip registration • HF chip registration • UHF chip registration • Why should we trace textiles? Every product that is used in a micro- • electronics process needs to registered, tracked and controlled. To provide management information on • usage, non-usage, availability, stock levels and conditions. What is the future trend? More control • Chip will be used more than only • traceability and providing information 13 13
Connected Cleanroom™ An innovative new digital platform providing smart data Data Dashboards around your cleanroom and facility. Benefits: • Cost control - clear picture of items not scanned • Decreased apparel loss - transparency of service cycle Scan Station • Simplified benchmarking - through customizable dashboards • Stock control - have on site what is really needed • Increased SOP compliance - track and guide operator behavior Smart textile dispenser 14
Textile Management Digitalized Textile & Service management portal to increase Contamination Control (compliance) and decrease YOUR cost in use Consists of three parts: 3 2 24 / 7 access to On site Borrow and Smart Cabinet for 21 Interactive Return station for storing your textiles, Dashboard each changing area mops, goggles etc. 15 15
Textile Management Dashboard 24/7 Interactive behaviour dashboarding insight on all devices 1 Stock Department Management: Management: Control and Visualization of usage benchmark between departments Portfolio Management: Cost control FiFo Management: of your stocks Optimization of your stock 16
Textile Management scanstation 2 On site scanning: borrow / return station IPAD with WiFi/4G Surface allowing scanning of UHF Reader items integrated for Encapsulation automatic for directional scanning scanning Small unit meeting fits to all cleanroom changing areas independent of size 17
Textile Management Dashboard 2 Proof of SOP compliance OPERATOR: • Overview of garment usage by operator • Historical garment usage data of operator • Reminder for garments forgotten to be returned. MANAGER: • Full overview of the garments and operators in the facility. • Improved insight for SOP compliance of operators. 18 18
Textile Management cabinets 3 Smart textile dispensing Up to 1000 garments Connected Cabinets 2 version, systems can be placed anywhere, improving accessibility and saving time for everyone offering real time insight through UHF technology. Real time control via App cm 225 225 cm 19
4C model Complete Contamination Control Cycle 20
No more qualified guesses about.. Is everyone using the right textile(s)? Can I prove that we are working SOP compliant? Do I have enough garments for the rest of the week? Where is my textile? Am I not having too many textiles? Behavioral CONTROL = contamination control IT IS DIGITALIZATION AT ITS BEST, SO YOU CAN PERFORM AT YOUR BEST 21 21
22 Arthur.Lettinga@elis.com
Recommend
More recommend