Comparing two proportions Beginning Bayes in R Learning about many - PowerPoint PPT Presentation
BEGINNING BAYES IN R Comparing two proportions Beginning Bayes in R Learning about many parameters Chapters 2-3 : single parameter (one proportion or one mean) Chapter 4 : multiple parameters Two proportions from independent
BEGINNING BAYES IN R Comparing two proportions
Beginning Bayes in R Learning about many parameters ● Chapters 2-3 : single parameter (one proportion or one mean) ● Chapter 4 : multiple parameters ● Two proportions from independent samples ● Normal sampling where both M, S are unknown ● Simple regression models
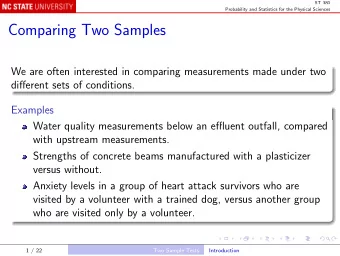
Beginning Bayes in R Types of inferences ● Making comparisons between groups: ● Is one proportion larger than another? ● Regression e ff ects (e.g. comparing two means): ● Does Rafael Nadal take longer than Roger Federer to serve?
Beginning Bayes in R Exercise among college students What proportion of students exercise 10 hours a week? Does this proportion vary between men and women?
Beginning Bayes in R Inferential problem ● Let p W and p M represent the proportions of college women and men who exercise 10 hours a week, respectively ● Various hypotheses: ● p W > p M (women exercise more) ● p W = p M (women and men exercise about the same)
Beginning Bayes in R Models: A discrete approach ● A model is a pair: (p W , p M ) ● Suppose each could be one of nine values 0.1, 0.2, 0.3, …, 0.9 ● Have 9 x 9 = 81 possible models
Beginning Bayes in R Here are the 81 models Row is p W , column is p M , each X corresponds to model: 0.1 0.2 0.3 0.4 0.5 0.6 0.7 0.8 0.9 0.1 x x x x x x x x x 0.2 x x x x x x x x x 0.3 x x x x x x x x x 0.4 x x x x x x x x x 0.5 x x x x x x x x x 0.6 x x x x x x x x x 0.7 x x x x x x x x x 0.8 x x x x x x x x x 0.9 x x x x x x x x x
Beginning Bayes in R A prior ● Di ffi cult to construct ● Describes a relationship between the proportions: ● There is a 50% chance that p W = p M ● Otherwise, you don’t know about relative likelihoods
Beginning Bayes in R Testing prior > # Construct a prior for Prob(p1 = p2) > library(TeachBayes) > prior <- testing_prior(lo = 0.1, hi = 0.9, np = 9, pequal = 0.5) > round(prior, 3) 0.1 0.2 0.3 0.4 0.5 0.6 0.7 0.8 0.9 0.1 0.056 0.007 0.007 0.007 0.007 0.007 0.007 0.007 0.007 0.2 0.007 0.056 0.007 0.007 0.007 0.007 0.007 0.007 0.007 0.3 0.007 0.007 0.056 0.007 0.007 0.007 0.007 0.007 0.007 0.4 0.007 0.007 0.007 0.056 0.007 0.007 0.007 0.007 0.007 0.5 0.007 0.007 0.007 0.007 0.056 0.007 0.007 0.007 0.007 0.6 0.007 0.007 0.007 0.007 0.007 0.056 0.007 0.007 0.007 0.7 0.007 0.007 0.007 0.007 0.007 0.007 0.056 0.007 0.007 0.8 0.007 0.007 0.007 0.007 0.007 0.007 0.007 0.056 0.007 0.9 0.007 0.007 0.007 0.007 0.007 0.007 0.007 0.007 0.056
Beginning Bayes in R Plot of testing prior > library(TeachBayes) > draw_two_p(prior)
Beginning Bayes in R Likelihood ● We survey 40 students on their exercise habits ● 10 out of 20 women exercise; 14 out of 20 men exercise ● Assuming independent samples, likelihood is a product of binomial densities > Likelihood <- dbinom(10, size = 20, prob = pW) * dbinom(14, size = 20, prob = pM)
Beginning Bayes in R Posterior probabilities > # Recall prior: > library(TeachBayes) > prior <- testing_prior(lo = 0.1, hi = 0.9, np = 9, pequal = 0.5) > # Multiply prior by likelihood, then normalize products > post <- two_p_update(prior, c(10, 10), c(14, 6))
Beginning Bayes in R Plot of posterior > library(TeachBayes) > draw_two_p(post)
Beginning Bayes in R Summarize the posterior ● Interested in proportions of men and women who exercise ● Posterior probabilities of the di ff erence: d = p M - p W ● two_p_summarize() : finds posterior probabilities of d
Beginning Bayes in R Compute posterior of d > library(TeachBayes) > d <- two_p_summarize(post) > head(d) # A tibble: 6 × 2 diff21 Prob <dbl> <dbl> 1 -0.8 3.150309e-15 2 -0.7 2.645338e-11 3 -0.6 1.137921e-08 4 -0.5 1.247954e-06 5 -0.4 4.039640e-05 6 -0.3 5.966738e-04
Beginning Bayes in R Graph of probabilities of d > library(TeachBayes) Recall the prior said there was 50% chance > prob_plot(d) the proportions were equal (i.e. d = 0)
Beginning Bayes in R Interpret P(p W < p M ) P(p W = p M ) P(p W > p M ) Prior 0.25 0.50 0.25 0.444 0.528 0.028 Posterior There is li � le evidence to say that the two proportions are di ff erent
BEGINNING BAYES IN R Let’s practice!
BEGINNING BAYES IN R Proportions with continuous priors
Beginning Bayes in R Exercise among college students ● Interested in proportions of women and men who exercise ● Let p W and p M represent the proportions of college women and men who exercise at least 10 hours a week ● Does this proportion vary between men and women?
Beginning Bayes in R Inferential problem ● Various hypotheses: ● p W = p M (women and men exercise about the same) ● p W > p M (women exercise more)
Beginning Bayes in R Continuous models ● Previously, considered discrete prior models for two proportions ● View each proportion as continuous from 0 to 1
Beginning Bayes in R One model p M p W
Beginning Bayes in R Prior? ● Unit square represents all possible pairs of proportions ● Probabilities represented by smooth surface over unit square ● Di ffi cult to construct priors that reflect dependence between two proportions p W and p M
Beginning Bayes in R Prior using beta densities ● Assume beliefs about p W are independent of beliefs about p M ● Use one beta curve to represent beliefs about p W , another to represent beliefs about p M ● Here we illustrate uniform priors: ● p W is beta(1, 1) ● p M is beta(1, 1)
Beginning Bayes in R 1000 simulations from prior > df <- data.frame(pW = rbeta(1000, 1, 1), pM = rbeta(1000, 1, 1)) > ggplot(df, aes(pW, pM)) + geom_point() + xlim(0, 1) + ylim(0, 1) p M p W
Beginning Bayes in R Updating … ● We surveyed 40 students on their exercise habits ● 10 out of 20 women exercise; 14 out of 20 men exercise ● Prior assumed two independent beta(1, 1) curves ● Posterior of (p W , p M ) is also a beta curve: ● p W is beta(10 + 1, 10 + 1) ● p M is beta(14 + 1, 6 + 1)
Beginning Bayes in R Simulation to summarize posterior > # Simulate pW from beta(11, 11) curve > pW <- rbeta(1000, 11, 11) > # Simulate pM from beta(15, 7) curve > pM <- rbeta(1000, 15, 7)
Beginning Bayes in R Graph of posterior of (p W , p M ) > df <- data.frame(pW, pM) > ggplot(df, aes(pW, pM)) + geom_point() + xlim(0, 1) + ylim(0, 1) p M p W
Beginning Bayes in R Prob(p W < p M )? p M p W
Beginning Bayes in R Prob(p W < p M )? > # Probability that pW < pM > with(df, sum(pW < pM) / 1000) [1] 0.891
Beginning Bayes in R Posterior of di ff erence p M - p W > # For each simulated (pW, pM), compute d = pM - pW > df$d_21 <- with(df, pM - pW) > # Plot histogram > ggplot(df, aes(d_21)) + geom_histogram(color = "black", fill = "red")
Beginning Bayes in R Posterior of di ff erence p M - p W
Beginning Bayes in R Probability interval for d > # Compute 90% interval > (Q <- quantile(df$d_21, c(0.05, 0.95))) 5% 95% -0.07442153 0.41724768 P(-0.07 < pM - pW < 0.42) = 0.9 Since the interval contains zero, there’s no significant evidence to say the proportions are di ff erent
BEGINNING BAYES IN R Let’s practice!
BEGINNING BAYES IN R Normal model inference
Beginning Bayes in R Learning about a normal model ● Chapter 3 : inference on mean M of a normal sampling model, assumed standard deviation S ● Chapter 4 : mean M and standard deviation S are both unknown ● Revisit Roger Federer’s time-to-serve data
Beginning Bayes in R Prior? ● Both M and S are continuous ● Not easy to think about beliefs about pairs (M, S) ● So we focus on the use of a standard "non-informative" prior
Beginning Bayes in R Non-informative prior ● Standard non-informative prior for mean M and standard deviation S looks like: ● How to understand this prior? ● Assign M a normal prior with large standard deviation ● Assign S a normal prior with large standard deviation ● These beliefs approximate non-informative prior
Beginning Bayes in R The data > # Input observed times-to-serve > Fed <- data.frame(Player = "Federer", Time_to_Serve = c(20.9, 17.8, 14.9, 12.0, 14.1, 22.8, 14.6, 15.3, 21.2, 20.7, 12.2, 16.2, 15.6, 19.4, 22.3, 14.1, 18.1, 23.6, 11.0, 17.3))
Beginning Bayes in R Posterior? ● Likelihood of this data is given: > Likelihood <- prod(dnorm(Time_to_Serve, mean = M, sd = S)) ● Posterior density of (M, S): Non-informative prior
Beginning Bayes in R Posterior calculation ● Simulate (M, S) from the 2-parameter posterior ● Summarize posterior sample to perform inference ● Simulate using the sim() method from the arm package
Recommend


More recommend
Explore More Topics
Stay informed with curated content and fresh updates.