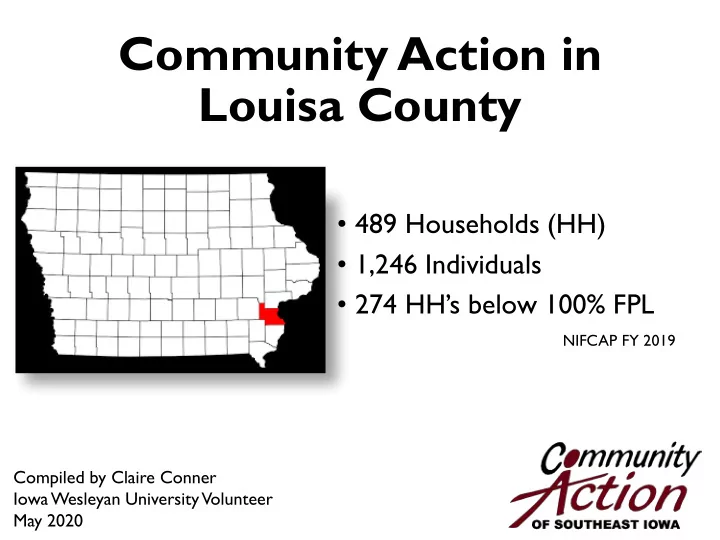

Community Action in Louisa County • 489 Households (HH) • 1,246 Individuals • 274 HH’s below 100% FPL NIFCAP FY 2019 Compiled by Claire Conner Iowa Wesleyan University Volunteer May 2020
5 Neighborhood Centers • 700 Jefferson, Burlington • 1303 W. Washington, Mt. Pleasant • 3433 Avenue O, Fort Madison • 220 South 22 nd Street, Keokuk • 202 E. Access Street, Suite D, Columbus Junction
History • 1 of 16 Community Action Agencies in Iowa, over 1,000 Nationally • Established in 1964 • Economic Opportunity Act • President Lyndon Johnson • Non-profit • Not government entity • Funded by government grants and local funding
Mission: Community Action of Southeast Iowa is dedicated to alleviating the conditions and causes of poverty by building partnerships and strengthening people through quality services.
Households Served by County 3,000 2,910 2,500 2,000 2,013 1,500 1,000 840 500 489 0 Des Moines Lee Henry Louisa NIFCAP FY 2019
Executive Director: Sheri Wilson Board President: Barb Welander 12-15 Local Representatives Serve as Agency Board Members 8 Directors Serve on Management Staff Louisa County Board Members Cyndi Mears Randy Griffin
Served in Fiscal Year 2019 14,628 Individuals 6,263 Households 4 Counties 13.83% Of the Population of Southeast Iowa NIFCAP FY 2019
Federal Poverty Level (FPL) Guidelines (Annual) Household 100% 125% 175% 185% 200% Size Head Start CSBG Energy Assistance WIC Weatherization 1 $12,490 $15,612.50 $21,857.50 $23,106.50 $24,980 2 $16,910 $21,137.50 $29,592.50 $31,283.50 $33,820 3 $21,330 $26,662.50 $37,327.50 $39,460.50 $42,660 4 $25,750 $32,187.50 $45,062.50 $47,637.50 $51,500 5 $30,170 $37,712.50 $52,797.50 $55,814.50 $60,340 6 $34,590 $43,237.50 $60,532.50 $63,991.50 $69,180 7 $39,010 $48,762.50 $68,267.50 $72,168.50 $78,020 8 $43,430 $54,287.50 $76,002.50 $80,345.50 $86,860 For each additional $4,420 $5,525 $7,735 $7,992 $8,840 person add: SOURCE: Federal Register January 1, 2019
LOUISA COUNTY HOUSEHOLDS 47.59% eligible for In Pov free or 11% reduced lunch Not in (185% of FPL) Pov 89% NCES–Common Core of Data 2016-17 American Community Survey 2014-18
100 F PL %
Approximate Wages at Poverty Level for a Single Person Above 100% FPL 32 hrs./wk. 52 wks./yr. $7.25/hr. Above 200% FPL 40 hrs./wk. 52 wks./yr. $11-12/hr.
- Iowa Policy Council 2019
Population Change 2000-2018 20 15 14.74 10 7.05 5 0 -5 -7.88 -10 Louisa County, IA Iowa USA Population change -7.88 7.05 14.74 US Census Bureau, American Community Survey 2014-18
Poverty Increase Louisa County 2000-2018 2.3% Iowa Average 2.9% National Average 1.8% US Census Bureau, Small Area Income & Poverty Estimates 2018
Poverty Rate by Family T ype Louisa County, IA Male Householder, Married 20.9% Couples, 49.6% Female Householder, 29.5% US Census Bureau, American Community Survey, 2014-18
Youth Not Employed Or In School Youth ages 16-19 12.00% 10.79% 10.00% 8.00% 6.78% 6.00% 4.81% 4.00% 2.00% 0.00% Louisa County, IA Iowa United States US Census Bureau, American Community Survey, 2014-18
Unemployment Rate 4.6% 4.5% 4.5% 4.4% 4.2% 4.0% 3.8% 3.8% 3.6% 3.4% Louisa County, IA Iowa United States US Department of Labor, Bureau of Labor Statistics. 2020-March.
83.2% of Households Served Had Income from Employment 5.7% Received Temporary Assistance for Needy Families (TANF), sometimes referred to as welfare 2019 NIFCAP
Income Sources by Household Social Security Employment Only SSI Employment Plus Other No Income Pension TANF Unemployment 0 500 1000 1500 2000 2500 3000 3500 4000 NIFCAP FY 2019
Services for Children • (WIC) Special Supplemental Nutrition Program for Women, Infants and Children • Head Start • Early Head Start • Parents as Teachers • Preschool Scholarships • Children’s Bed Program • Child and Adult Care Food Program (CACFP) • Clothing Assistance • Food Pantry
Services for Families • Food Pantry • Energy Assistance • Homeless Assistance • (WIC) Special • Low Income Home • Housing Assistance Supplemental Nutrition Energy Assistance • Emergency Rent and Program for Women, Program (LIHEAP) Utilities Infants and Children • Energy Crisis Assistance • Elderly Home Repair • Head Start (Project Share) • Medication Assistance • Early Head Start • Weatherization Program (MAP) • Family Development • Furnace Repair and • Rent Reimbursement and Self Sufficiency Replacement Form Assistance Program (FaDSS) • Budget Counseling • Transportation • Parents as Teachers • Employment Counseling Assistance • Preschool Scholarships • Disaster Assistance • Children’s Bed Program • General Information • Clothing Assistance and Referral
Services for Adults • Food Pantry • General Information and Referral Resources • Low Income Home Energy Assistance Program (LIHEAP) • Homeless Assistance • Weatherization • Housing Assistance • Energy Crisis Assistance (Project • Emergency Rent and Utilities Share) • Senior Home Repair • Furnace Repair and Replacement • Medication Assistance Program • Budget Counseling (MAP) • Employment Counseling • Rent Reimbursement Form Assistance • Clothing Assistance • Transportation Assistance • Child and Adult Care Food Program (CACFP) • Disaster Assistance
T otal Agency Funding FY2019 $12,746,882 Total Federal Funding $11,009,500 Total State Funding $933,739 Total Private Funding $770,744 Total In Kind Donations $738,608 WIC Vouchers Given $1,841,502 Client Assistance Expenses $2,156,875
For more details regarding reports, programs, and services, please see our agency website: caofseia.org
Recommend
More recommend