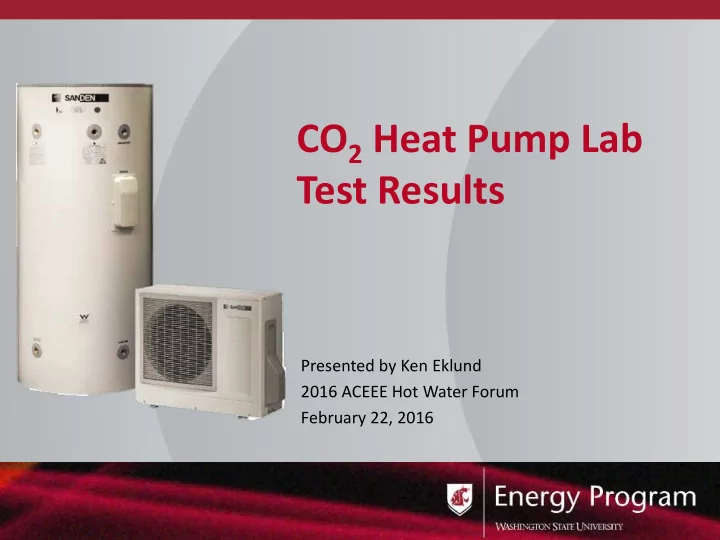

CO 2 Heat Pump Lab Test Results Presented by Ken Eklund 2016 ACEEE Hot Water Forum February 22, 2016
The CO2 Transcritical Cycle 2
CO2 Performance • CO2 does not condense • It transfers heat directly from the gas state, allowing it to operate at higher temperatures 3
Lab Tests • Laboratory Assessment of Demand Response Characteristics of Two CO2 Heat Pump Water Heaters—Ben Larson & Nick Kvaltine • Laboratory Assessment of Combination Space and Water Heating Applications of a CO2 Heat Pump Water Heater—Ben Larson, Michael Logsdon, & Nick Kvaltine 4
DEMAND RESPONSE Unitary System PNNL Lab Home 5
SPLIT SYSTEM 6
COP Map for 80-gallon Tank 7
Hot Water Draw Profile 8
Lab Test Draw and DR Schedule 9
80 Gallon Tank DR Profile Test at 50°F 10
Minimum and Mean Outlet Temperatures 80 gallon Ambient Minimum Temperature Mean Outlet Outlet (F) Temperature Temperature 35 136.9 145.9 50 139.8 145.9 67 138.2 144.1 11
Impact of System Off 12
Hourly Water Heat & Service Loads 13
COMBINED SYSTEMS 14
Space Heating Demand Profile Heating Call On/Off 0 1 2 3 4 5 6 7 8 9 10 11 12 13 14 15 16 17 18 Hour of Test 15
Low Temperature Space Heat Test Low Temp, Space Low Temp, Space Low Temp, Space Summary Statistic Heat, Bottom Inlet Heat, Diffuser Heat, No Diffuser HP Waterline In 80.3 92.4 91.3 HP Waterline Out 151.0 150.5 150.5 Taco Load Flow 3.8 3.8 3.8 Taco Sanden Flow 0.6 0.7 1.5 Taco Load Return Temp 71.8 71.3 70.0 Taco Load Supply Temp 81.4 81.1 80.4 Taco Sanden Return Temp 77.9 78.4 80.2 Taco Sanden Supply Temp 143.7 133.8 111.0 Stratification Index 0.72 0.33 0.33 Sanden kWh 8.18 9.19 9.37 Taco kWh 0.41 0.40 0.44 Total Input kWh 8.58 9.59 9.81 Space Heat Output (kBtu) 61.63 62.47 67.10 Total Output (kBtu)* 64.67 69.15 67.94 Equipment COP 2.49 2.30 2.10 System COP 2.21 2.11 2.03 16
High Temperature Space Heat Test High Temp, Space High Temp, Space High Temp, Space Summary Statistic Heat, Cold Inlet Heat, Diffuser Heat, No Diffuser HP Waterline In 108.8 109.9 110.6 HP Waterline Out 150.5 150.4 150.6 Taco Load Flow 3.6 3.6 3.6 Taco Sanden Flow 3.6 3.5 3.5 Taco Load Return Temp 100.2 100.3 100.9 Taco Load Supply Temp 109.1 108.7 109.3 Taco Sanden Return Temp 110.2 109.7 110.6 Taco Sanden Supply Temp 119.4 118.7 119.5 Stratification Index 0.40 0.38 0.42 Sanden kWh 14.22 12.80 13.01 Taco kWh 0.90 0.91 0.89 Total kWh 15.12 13.71 13.89 Space Heat Output (kBtu) 79.10 74.73 75.12 Total Output (kBtu)* 86.70 77.66 73.77 Equipment COP 1.90 1.90 1.67 System COP 1.68 1.66 1.56 17
Combined Demand Profile DHW GPM Heating Call 3.5 3 GPM or Heating Call On/Off 2.5 2 1.5 1 0.5 0 0 1 2 3 4 5 6 7 8 9 10 11 12 13 14 15 16 17 18 Hour of Test 18
Low Temperature Combination Test Low Temp, Combo, Cold Low Temp, Combo, Summary Statistic Inlet Diffuser HP Waterline In 73.7 88.2 HP Waterline Out 150.8 150.7 DHW Flow 38.4 38.4 Taco Load Flow 3.7 3.7 Taco Sanden Flow 0.6 0.7 Taco Load Return Temp 69.5 70.5 Taco Load Supply Temp 80.2 80.2 Taco Sanden Return Temp 76.5 78.0 Taco Sanden Supply Temp 146.6 127.6 Stratification Index 0.57 0.4 Sanden kWh 18.62 15.68 Taco kWh 0.56 0.58 Total kWh 19.18 16.26 Space Heat Output (kBtu) 95.96 87.23 Domestic Water Output (kBtu) 25.4 22.22 Total Output (kBtu) 150.37 111.7 Equipment COP 2.61 2.29 System COP 2.3 2.01 19
Optimized Design • Design load of the building should match the capacity of the heat pump and its backup system. • Highest efficiencies are predicted for low temperature systems such as radiant floor • Space heat return water should be returned to the tank at the same temperature level—the tank should have multiple return options. • Cold water to replace DHW should be introduced at the bottom of the tank. • Tank size should be large—120 gallons to reduce de-stratification 20
Performance Predictions by Climate Annual Efficiency Climate Water Space Combined Heating Heating Boise 2.9 2.3 2.5 Kalispell 2.6 2.1 2.2 Portland 3.0 2.6 2.7 Seattle 2.9 2.6 2.7 Spokane 2.8 2.2 2.4 Heating Zone 1 2.9 2.5 2.6 Heating Zone 2 2.8 2.2 2.4 Heating Zone 3 2.6 2.1 2.2 21
Thanks To Adria Banks, WSU lead analyst To Ben Larson, Jonathan Heller, Nick Kvaltine and Colin Grist, Ecotope To Melinda Spencer, WSU technical editor To Bruce Carter, Fred Gordon, Rem Husted, Tom Lienhart, & Jim Maunder—utility partner reps To PNNL’s Graham Parker, Joe Petersen & Sarah Widder & Greg Sullivan, Efficiency Solutions To Mark Jerome, Clear Result, lead installer To David Hales, WSU lead monitoring installer To Janice Peterson, BPA project manager To Dave Kresta & Charlie Stephens, NEEA To Maho Ito, John Miles, & Charles Yao, Sanden International To the Regional Advanced HPWH Advisory Task Force 22
Contact Information • Ken Eklund , Building Science & Standards Lead Washington State University Energy Program eklundk@energy.wsu.edu Project Principle Investigator and Manager 23
Washington State University Energy Program DISCUSSION 24
Recommend
More recommend